Database Reference
In-Depth Information
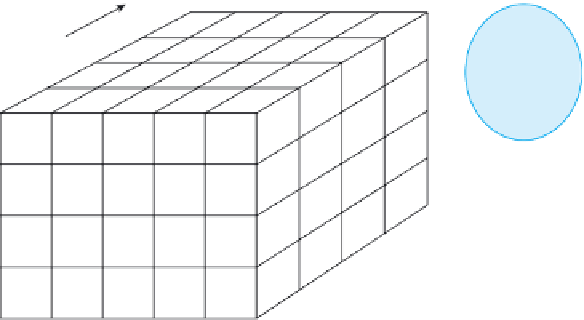
Each cell
contains
unit sales and
dollar sales
data
Part
Customer
298
Week1 Week
Current
Time
FIGURE 9-14
A data cube representation of the Part, Customer, and Time dimensions
When users access a data warehouse, their queries usually involve aggregate data, such as total sales by
month and average sales by customer. As users view the aggregate results from their queries, they often need
to perform further analyses of the data they
'
re viewing. OLAP software should let users perform these analy-
ses as easily and quickly as possible.
Users
'
analyses typically involve actions that include the following:
Slice and dice. Instead of viewing all data in a data cube, users typically view only portions of
the data. You slice and dice data to select portions of the available data or to reduce the data
cube. For example, suppose the Time dimension in the conceptual data cube that appears in
Figure 9-14 contains detailed sales data on a weekly basis for Premiere Products. Further, sup-
pose the sales manager queries the data warehouse to view this week
'
s total sales, both in dollars
and in units sold, as shown in Figure 9-15.
TotalDollars
TotalUnits
$8,911.14
28
FIGURE 9-15
Total sales query results
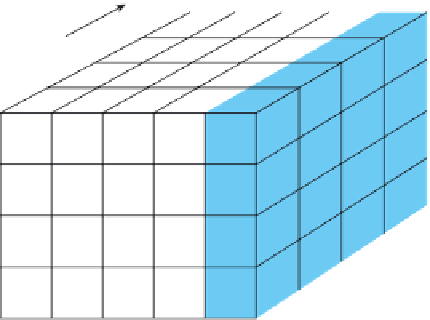
Conceptually, the sales manager
'
s query slices the data cube to reduce it to the shaded
“
Week Current
”
portion, which is shown in Figure 9-16.
Part
Selected slice
contains sales
data for the
current week
Customer
Week1 Week
Current
Time
FIGURE 9-16
Slicing the data cube based on the Time dimension


