Environmental Engineering Reference
In-Depth Information
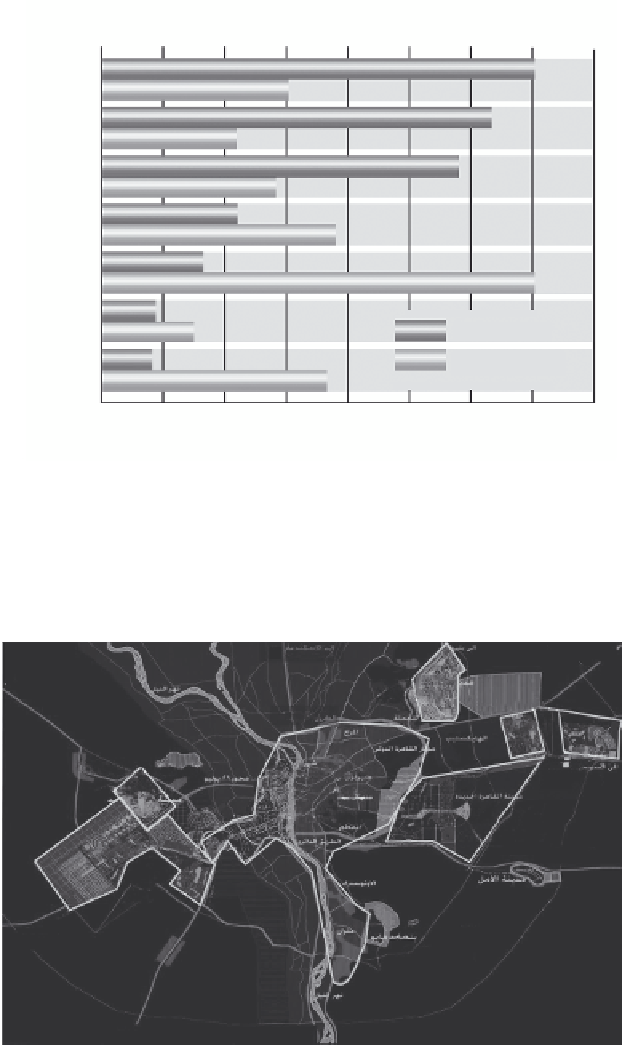
Particle matter in 2002 (µg/m
3
)
0
50
100
150
200
Delhi
(India)
1st
Cairo
(Egypt)
2nd
3rd
Calcutta
(India)
Mexico City
(Mexico)
41st
To kyo
(Japan)
57th
London
(UK)
New Yo rk
(US)
91st
Pollution levels
Population levels
96th
0
5
10
15
20
25
30
35
40
Population in 2005 (millions)
FIGURE 2.5
World's most polluted cities. (From The World Bank as cited in GlobeScan and MRC McLean
Hazel,
Megacity Challenges: A Stakeholder Perspective
, Siemens AG, Munich, 2007.)
To Alexandria
To ismailia
Obour City
1,00,000 p
To Alexandria
Shorouk City
62,000 p
Badr City
60,000 p
Ring road
Sheikh Zaied City
40,000 p
Greater Cairo
urban mass
14 million p
New Cairo
City 3,02,000 p
6 October
City
5,00,000 p
To Ein sokhna
15 May City
1,80,000 p
To Oasis
To Fayoum
To upper Egypt
FIGURE 2.6
Greater Cairo with the surrounding new cities.