Environmental Engineering Reference
In-Depth Information
CO
2
10
8
Environmental governance
Energy
6
4
2
0
Air quality
Buildings
Transport
Wa ste and land use
Amsterdam
Best
Average
Water
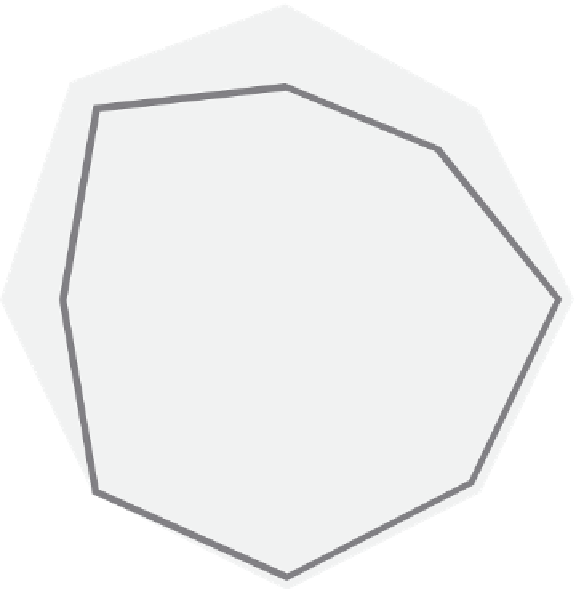
FIGURE 1.3
Green City Index for European cities. (From
Green City Index
, Siemens, Retrieved May 7, 2012,
from http://www.siemens.com/entry/cc/en/greencityindex.htm.)
The index is composed of aggregate scores of all of the underlying
indicators. It is first aggregated by category, creating a score for each area
of infrastructure and policy (i.e. energy). Finally, overall, it is based on the
composite of the underlying category scores. To create the category scores,
each underlying indicator is aggregated according to an assigned weight-
ing. In general, most indicators receive the same weighting, or importance,
in the index. The category scores are then rebased onto a scale of 0-10.
To build the overall index scores, the EIU assigned even weightings on
each category score; the index is essentially the sum of all category scores,
rebased out of 100. This equal weighting reflects feedback from the expert
panel as well as wider research on measuring environmental sustainability,