Agriculture Reference
In-Depth Information
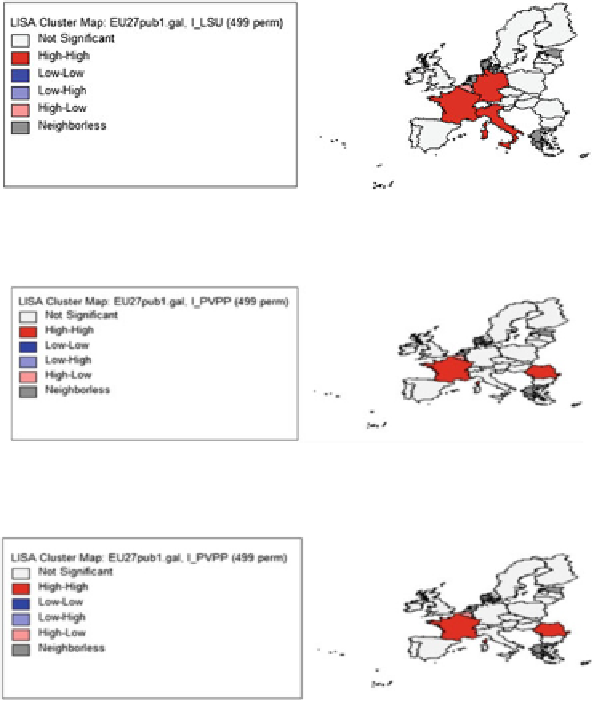
Fig. 3.22 Local spatial autocorrelation (one neighbor in a queen contiguity matrix) for the
logarithm of the average LSU livestock among European Union countries
Fig. 3.23 Local spatial autocorrelation (one neighbor in a queen contiguity matrix) for the
logarithm of the average production value at basic price (millions of euro, base year: 2005
100)
¼
Fig. 3.24 Local spatial autocorrelation (one neighbor in a queen contiguity matrix) for the
logarithm of the average production value at producer price (millions of euro, base year:
2005
100)
¼
3 Results
In the following two tables are presented the results obtained with cross-section
regressions, considering the agricultural output at basic prices (Table
3.1
) and the
agricultural output at producer prices (Table
3.2
) as dependent variables. The other
variables were tested as independent variables and the best statistic results were
obtained for the model with agricultural employment as an independent variable.
The consideration of the two prices (basic and producer prices) was to analyze the
influence of tax and subsides, removed from basic prices, in the value of agricul-
tural production and in the dynamics of the agricultural sector.
The values of the statistic tests confirm the robustness of the results obtained. On
the other hand, the values of the tests for spatial autocorrelation (Moran's I and LM)
reveal an absence of spatial autocorrelation problems in the regression.
Search WWH ::

Custom Search