Agriculture Reference
In-Depth Information
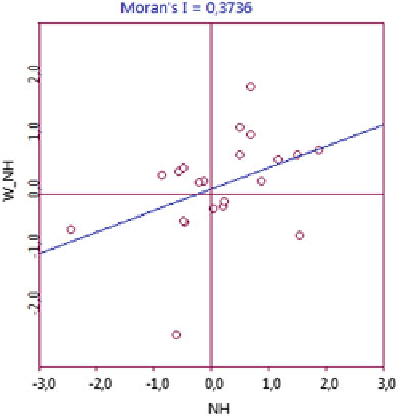
Fig. 3.15 Global spatial
autocorrelation (one
neighbor in a queen
contiguity matrix) for the
logarithm of the average
number of holdings among
European Union countries
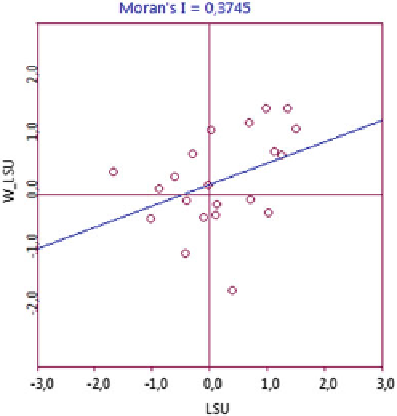
Fig. 3.16 Global spatial
autocorrelation (one
neighbor in a queen
contiguity matrix) for the
logarithm of the average
LSU livestock among
European Union countries
(because with more than one neighbor the value of Moran's I became negative). In
analyzing the following six figures, it is possible to conclude that there is positive
global spatial autocorrelation, considering one neighbor country in all directions, in
all variables, but the stronger value being for agricultural employment (this shows
the importance of this variable for agriculture in Europe).
Figures
3.19
,
3.20
,
3.21
,
3.22
,
3.23
, and
3.24
reveal the values of Moran's I for
the local autocorrelation (for each individual European Union country). The values
high-high and low-low represent positive spatial autocorrelation for the countries
Search WWH ::

Custom Search