Game Development Reference
In-Depth Information
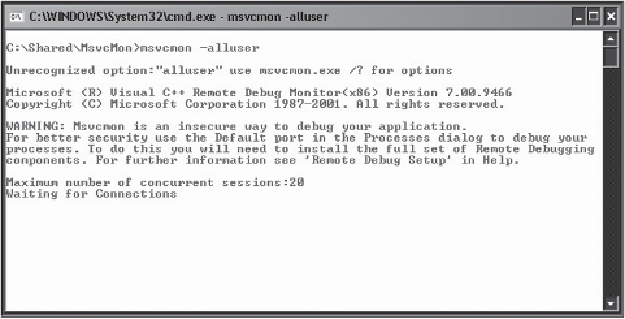
Figure 23.2
Running MSVSMONwith the
/noauth
switch.
Once you get the connection madness out of the way, the remote machine is ready to
start your game. Start the debugging session on your development machine (F5 in
Visual Studio), and you
'
ll see your game initialize on the remote machine. When
you find a bug and rebuild your application, make sure that the remote machine
has access to the most recent bits.
UNIX programmers have had a special advantage over Windows programmers since the
beginningoftimebecausewhenaUNIXprogram crashes, the operating system copies
theentirememoryimageofthecrashedprogramtodisk.Thisiscalledacore dump.
Needless to say, the core dump is usually quite large. UNIX debuggers can read the
core dump and allow a programmer to look at the state of the process at the moment
the crash occurred. Assuming the symbol files for the executable in question are
available, they can see the entire call stack and even find the contents of local vari-
ables. This doesn
'
t always expose the bug entirely, as some crashes can happen as a
result of a bug
s misbehavior in a completely separate part of the program, but this
information is much better than a tester just telling you the game crashed.
Windows dump files have been debuggable by a little-known Windows debugger
called WinDBG since the Windows NT days. These dump files were just as huge as
the UNIX core dumps. It didn
'
'
t matter very much, since most Windows developers
didn
'
t even know that WinDBG even existed
—
they always used the debugger in
Visual Studio.

