Game Development Reference
In-Depth Information
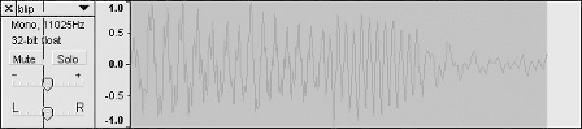
Figure 13.1
A typical sound wave.
You
ve probably seen a graphic rendering of a sound wave; it looks like some random
up-and-down wiggling at various frequencies and amplitudes (see Figure 13.1).
This scratching is actually a series of values that map to an energy value of the sound
at a particular moment in time. This energy value is the power level sent into a
speaker magnet to get the speaker cone to move, either in or out. The frequency, or
tone, of the sound is directly related to the number of up/down wiggles you see in the
graphic representation of the waveform. The speaker is reproducing, to the best of its
ability, the identical waveform of the sound that was recorded in the studio.
If you zoom into the waveform, you
'
ll see these energy values plotted as points above
and below the X-axis (see Figure 13.2).
If all the points were in a straight line at value 0.0f, there would be complete silence.
The odd thing is, if all the points were in a straight line at 1.0, you would get a little
“
'
”
at the very beginning and silence thereafter. The reason is the speaker cone
would sit at the maximum position of its movement, making no vibrations at all.
The amplitude, or height, of the waveform is a measure of the sound
pop
s intensity.
Quiet sounds only wiggle close to the 0.0 line, whereas loud noises wiggle all the
way from 1.0f to -1.0f. You can also imagine a really loud noise, like an explosion,
has an energy level that my Boston Acoustics can
'
t be accurately
recorded anyway because of the energies involved. Figure 13.3 shows what happens
to a sound wave that fails to record the amplitude of a high-energy sound.
Instead of a nice waveform, the tops and bottoms are squared off. This creates a
nasty buzzing noise because the speaker cones can
'
t reproduce and can
'
'
t follow a nice smooth waveform.
Figure 13.2
A closer view of a sound wave.