Information Technology Reference
In-Depth Information
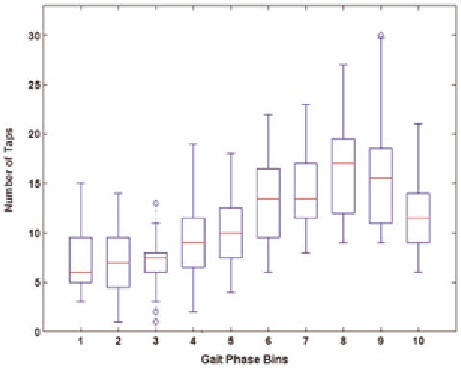
Figure 10. Box plot visualising the distribution of tapping times. Median phase in which the user taps
(split into 10 sections) with the reset position for the phase corresponds to the lowest point of the arm
which occurs just after a step.
Figure 11. Median target tap error in pixels for each phase of the motion (split into 10 segments) with the
reset position for the phase corresponding to the lowest point of the arm which occurs just after a step.
Left-Right Step Analysis
tapping at a time in their step when it was easier
to tap more accurately. The longer time to tap in
the high probability region indicates that users
tended to subconsciously wait for that particular
phase region to tap in.
For the previous set of results, each step has been
treated as one cycle. However, we could also
choose to separate out the left foot steps from
the right foot steps. As the user walks, the verti-


Search WWH ::

Custom Search