Information Technology Reference
In-Depth Information
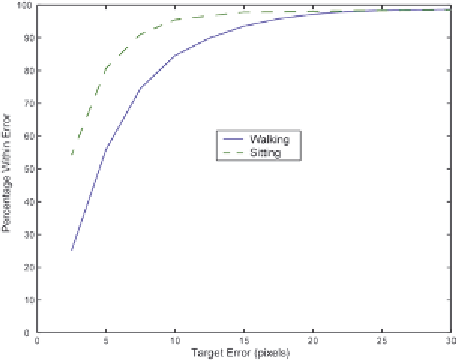
Figure 7. Percentage of taps with the given pixel radius for sitting and walking users
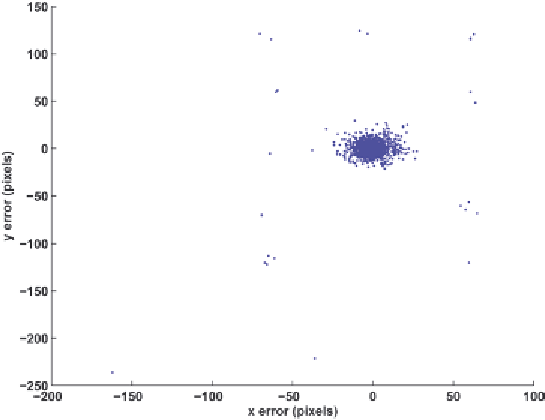
Figure 8. The x- y pixel errors for all users for all targets. The structure of the 3 by 5 grid of targets can
be seen indicating users mistakenly double tapping.
Figure 9 shows the mean variability and co-
variance of the
x
and
y
target errors for all users
for each of the 15 targets. In almost all cases,
the variability in tapping is smaller in the seated
condition than in the walking condition. Due to
the controlled conditions of this study, the move-
ments to the outer targets were always from centre
target. The variability in tap position for the centre
targets is less than that of the outer targets. This
is due to the fact that the stylus over the centre
target position was the default position for most
users. Covariance of the
x
and
y
tap positions can
be seen to be along the direction of movement for
most of the targets. This is particularly true for
the corner targets.
Search WWH ::

Custom Search