Information Technology Reference
In-Depth Information
Tap Accuracy
Details of the Hilbert transform and filtering
are included here for completeness, however, this
functionality is easily accessible in many standard
data analysis programs such as Matlab through
simple function calls and understanding these
equations is not essential for understanding the
remainder of this article.
A graph of tapping accuracy is shown in Figure
7. The graph demonstrates that as expected, users
were more accurate tapping in the seated condi-
tion with 78% of taps being within 5 pixels in the
seated case compared to 56.5% in the walking
case. Participants remained more accurate in the
seated case and reached 98% of taps within 15
pixels in the seated condition compared to 25
pixels in the walking condition. Separating these
into
x
and
y
pixel error showed little difference
between accuracy in vertical or horizontal error.
Above the range of 30 pixels, structure can be
seen in the errors where tap position corresponds
to the position of the previous target (shown in
Figure 8). This indicates a tap when the user did
not mean to tap. This is most likely the result of
a user accidentally double tapping in position of
the previous target. These taps were viewed as
outliers and discounted from the final analysis.
Observation in the walking condition showed
that when tapping, all participants immediately
adopted the strategy of grounding the side of their
hand holding the stylus on the hand holding the
device to reduce independent movement of the
hands and thereby improve accuracy. Targeting
therefore involve pivoting the hand about the
grounded position.
Standard Usability Results
Time to Tap
The mean time to tap was lower in the sitting case
than the walking case as would be expected. The
mean time to tap a target in the walking condition
was 0.79s (std dev = 0.18) compared to 0.70s (std
dev = 0.22) in the seated case. This can be further
broken down into tapping the centre target and
outer targets. The mean time to tap the centre target
was 0.75s (std dev = 0.23) when walking and 0.65s
(std dev = 0.19) while sitting. This compared to
0.82s (std dev = 0.22) while walking and 0.75s (std
dev = 0.20) while sitting to tap the outer targets.
This difference between centre and outer targets
is indicative of users predicting the appearance
of the centre target since it consistently appeared
every second target.
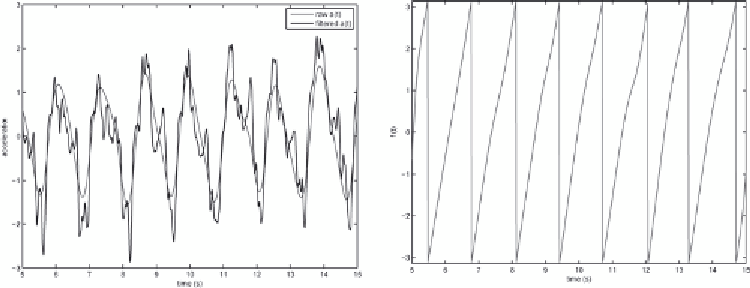
Figure 6. Generating the phase angle
ϕ
(t) from observed acceleration data a(t) from a user walking
Search WWH ::

Custom Search