Information Technology Reference
In-Depth Information
some and slow to use. They had problems of
figuring out how Gallery works as a whole and
what was needed to be done to carry out a task.
The participants wanted a mobile application to
be fast and smooth to use, as they might not have
many minutes to accomplish a task on the go.
The user experience evaluation also explains
why Image Exchange was strongly preferred by
the participants compared to Gallery, which was
not evident in the general or usability evaluation.
The participants took pleasure in using Image Ex-
change even though they also got things done with
Gallery. Image Exchange enabled the participants
to enjoyably interact with each other in real-time
on the go, while Gallery still required the partici-
pants to take care of many tasks (e.g. uploading
an image, syncing the image data) before they
could concentrate on the actual communication.
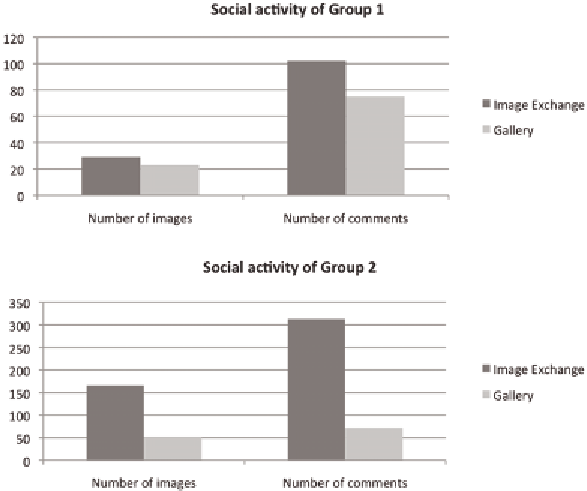
figure shows the number of published images dur-
ing the test periods. It also indicates the number
of comments that the participants added to the
images. The number includes new comments and
replies to existing comments.
The results reveal that both of the groups were
more active when using Image Exchange. Group
1 which switched from Gallery to Image Exchange
published 26% more images when using Image
Exchange. Also, the group added more comments
to images when using Image Exchange: the num-
ber of comments increased 36%. The figures for
Group 2 are even more convincing: Their activ-
ity when using Image Exchange for publishing
images was 325% higher than when they used
Gallery. Group 2 also added 420% more comments
when using Image Exchange.
The activity figures show that the groups had
different dynamics: Group 2 was clearly more
socially active than Group 1. However, the results
show that the activity was higher within both
groups while using Image Exchange. In addition,
the social activity was not dependent on the order
Social Activity
Lastly, the results of the social activity within the
participant groups are shown in Figure 10. The
Figure 10. The results of the social activity
Search WWH ::

Custom Search