Information Technology Reference
In-Depth Information
RESULTS AND DISCUSSION
ing an image to the service, publishing images,
browsing published images, commenting and
replying to comments. The tasks were the same
for both periods.
In addition to the daily task feedback, the users
were asked to keep a diary about their experiences
with the applications during the test period. This
was to gather their insights during the whole test
period as well as experiences about their own
use cases and challenges. We also logged data
on the server including the number of published
images and comments made by a user to measure
the social activity within the participant groups.
After testing each application, we asked the
participants to fill out a Web questionnaire includ-
ing closed and open questions about the applica-
tion. The Web questionnaire included three parts:
In the first section, we asked rating questions
about the general use; in the second section, we
had rating questions about other aspects of user
experience than usability; utility, social value and
enjoyment (Roto & Rautava, 2008); and the third
section included open questions, where we asked
the participants to list three best and worst things
in the application and improvement ideas.
After both periods, we asked the participants
to choose which application they preferred to use
for photo sharing in the future. We also organized
a 2-hour focus group session separately with each
of the two groups to discuss about their experi-
ences during the testing periods.
As described in the previous section, we collected
various types of feedback from the study partici-
pants. In the following sections, we discuss the
results related to the user experience and social
activity. To analyze the statistical differences
between the means of the ratings, we used a two-
tailed T-test, with alpha = 0.05.
Preference
After using both applications for 7 days each,
we asked the participants to evaluate which ap-
plication they would prefer to use in the future to
publish images with their mobile devices. We used
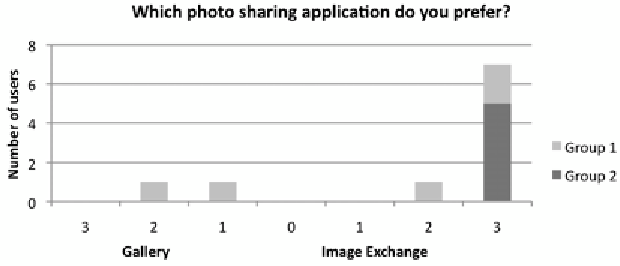
a 7-point scale, 3 meaning strong preference for
either application and 0 meaning no preference. 7
out of 10 participants preferred Image Exchange
very strongly and 8 participants in total (Figure 6).
All users who first used Image Exchange
(Group 2) clearly preferred it, whereas the prefer-
ence distribution of the group, which started with
Gallery (Group 1), varied more. The reason is that
Gallery had a feature for adding contacts to a list,
and the participants could easily check the latest
images from their contacts. Image Exchange did
not have this feature yet implemented as it was
still a prototype. The participants, who used Gal-
lery first, had used this feature right from the start
and missed it in Image Exchange. One participant
Figure 6. The preference of the application

Search WWH ::

Custom Search