Information Technology Reference
In-Depth Information
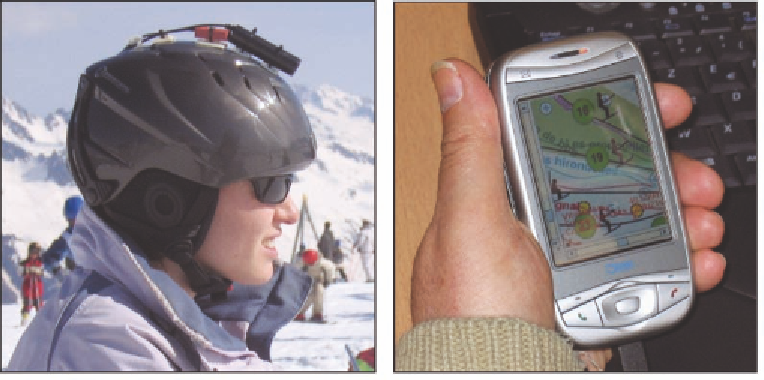
Figure 2. Helmet equipped with a mini-camera and an accelerometer (on the left) and service applica-
tion on the smartphone (on the right)
four camera focus systems jammed during the
experiment. These technical problems could prob-
ably be overcome in the future thanks to more
robust hardware.
Nevertheless, we obtained very interesting
information about the system usage. The activi-
ties of the skiers were rebuilt thanks to the SMS
bill, information server logs, and GPS tracking
records. We could determine the moments when
and where the skiers were proactively informed
of the availability of new data, and, when and
where they accessed the data. We were surprised
to discover that, actually, they exclusively used
the device, not on the trials but at the bar during
breaks! Users confirmed this in post-experiment
informal interviews. We concluded that the Trojan
Horse technique is not easy to implement in the
wild, but that user activity could be reconstructed
with partial information from computer logs. The
results could be consulted in French in (Jambon,
2006).
Museum experiment. We then set up a new
experiment to test the Trojan Horse technique in-
vivo with ubiquitous environments. The system
under test was a ubiquitous environment associated
with a temporary exhibition about camouflage and
private life at the Rhône Natural History Museum
in Lyon (France). The museum was equipped in
order to detect and identify visitor's movements
between halls and interactive information kiosks
could react to the visitors' presence. The objective
was to analyze the visitor's paths in the exhibition
and their usage of the information kiosks.
This experiment was also the opportunity for
us to test the scalability of in-vivo experiments.
We thus increased the duration of the experiment:
a few weeks instead of one day for E-skiing.
We also increased the number of users: several
hundreds of visitors instead of one group of four
skiers. The operation of this ubiquitous environ-
ment was based on radio frequency identification
tags (RFID). A tag, that looking like a postcard,
was given to the visitors with their entry tickets
(Figure 3). The visitor's tracks in the exhibition
were detected via a set of antennas.
The data were first cleaned up from incoherent
records because of technical failures or human
errors in the management of the postcards. Then,
a first level of analysis determined that about five
hundred visitors tracks were analyzed. A second
level of analysis determined the visits durations
(about one hour) and the types of tracks followed
Search WWH ::

Custom Search