Graphics Reference
In-Depth Information
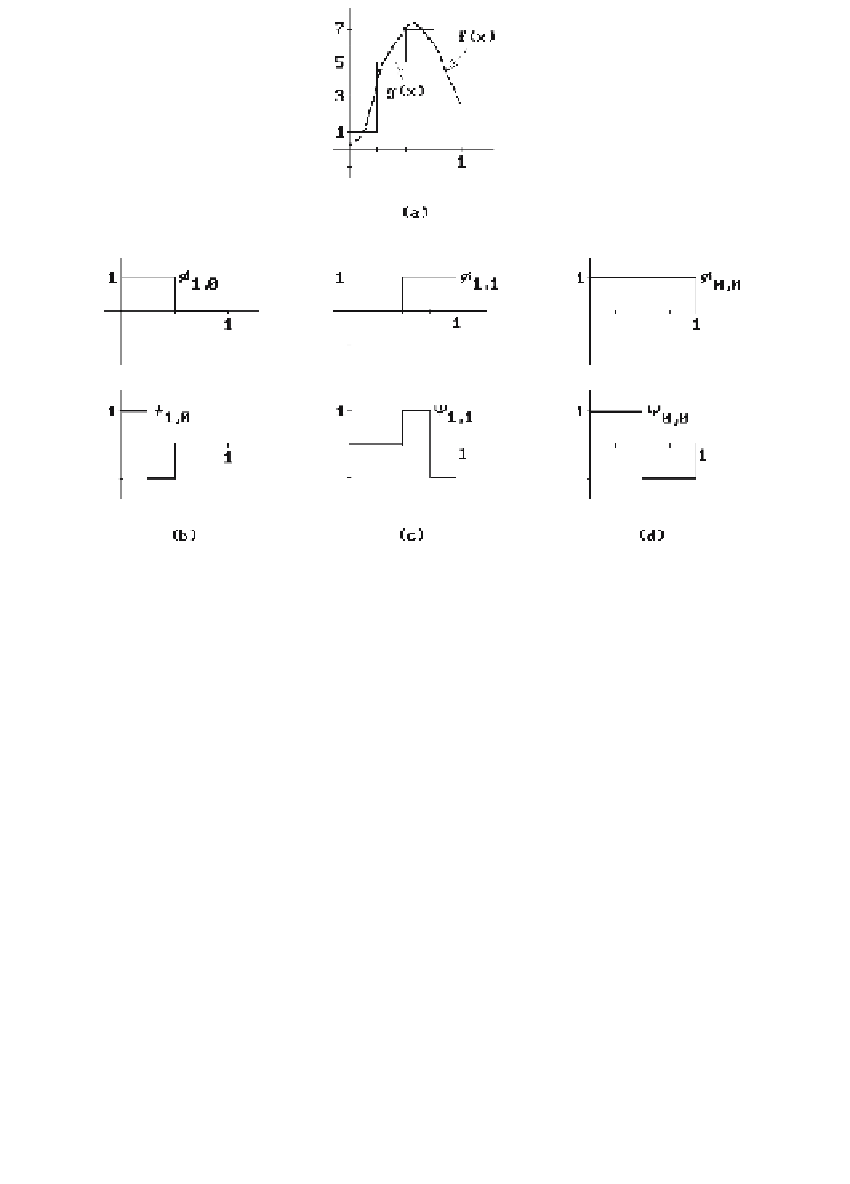
Figure 21.12.
Approximating with wavelets.
21.9.1 Example.
Consider the function f(x) in Figure 21.12(a). If the function was
sampled at four evenly spaced points with values 1, 5, 7, and 3, then its approxima-
tion would be the step function
()
=
()
+
()
+
()
+
()
gx
1
f
x
5
f
x
7
f
x
3
f
x
.
(21.21)
20
,
21
,
22
,
23
,
We show how this representation can be obtained with wavelets.
Step 1.
The first two sample values average to 3. To get the actual values back from
this difference we have to add -2 and +2, respectively. To put this another way,
()
+
()
=
()
-
()
1
f
x
5
f
x
3
f
x
2
y
x
,
(21.22)
20
,
21
,
10
,
10
,
as is easily checked. See Figure 21.12(b). Similarly, the second two sample values
average to 5. To get the actual values back from this difference we have to add +2 and
-2, respectively. Again, this means that
()
+
()
=
()
+
()
7
f
x
3
f
x
5
f
x
2
y
x
.
(21.23)
2 2
,
2 3
,
11
,
11
,
See Figure 21.12(c). Substituting (21.22) and (21.23) into (21.21) shows that
()
=
()
+
()
-
()
+
()
gx
3
f
x
5
f
x
2
y
x
2
y
x
.
(21.24)
10
,
11
,
10
,
11
,