Graphics Reference
In-Depth Information
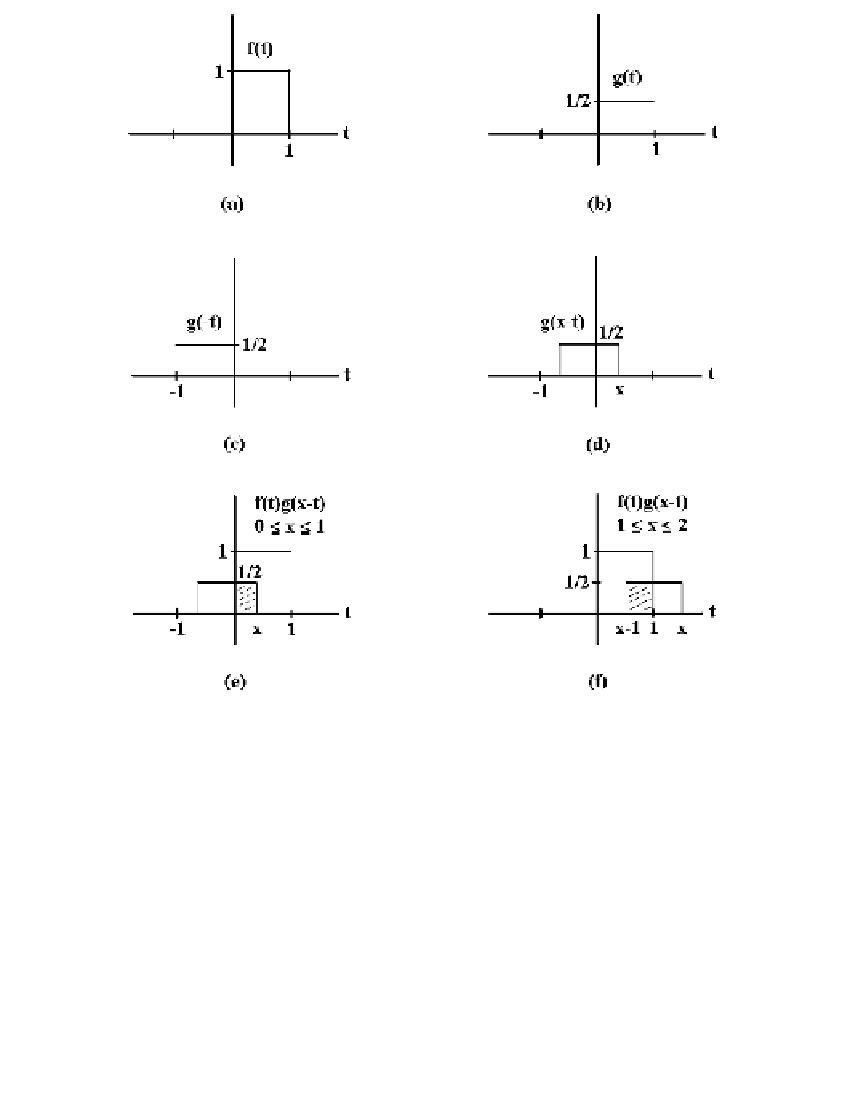
Figure 21.8.
An example of convolution.
1
2
()
=
[]
()
=
Œ
[]
ft
1
,
t
0 1
,
gt
,
t
01
,
[]
œ
[]
=
0
,
t
0 1
,
=
0
,
t
0 1
,
The graphs of the functions f(t) and g(t) are shown in Figures 21.8(a) and (b), respec-
tively. Figures 21.8(c) and (d) show the stages of computing g(x-t). The shaded regions
in Figure 21.8(e) and (f) show the areas computed by the convolution integral that