Graphics Reference
In-Depth Information
17.7
Voronoi Diagrams
Voronoi diagrams are structures that get used in many places in geometric modeling
and computational geometry. This section will define them and summarize some of
their more important properties. Some good references for more information about
them are [Aure91], [BKOS97], [PreS85], and [Edel87].
The general problem that Voronoi diagrams address is:
For each point
p
in a given a set
S
of points of a space
X
, find all the points of
X
that are
closest to
p
.
We make this more precise. We shall only consider Voronoi diagrams for the plane,
that is, the case
X
=
R
2
. This is the case that one encounters most often. At the end
of the section we shall make some comments about other cases.
Let
p
,
q
Œ
R
2
,
p
π
q
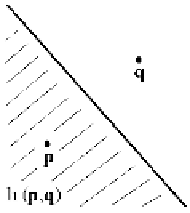
. Define the halfplane h(
p
,
q
) by
Definition.
{
}
(
)
=Œ
2
h
p q
,
r
R
pr
£
rq
.
It is easy to show that h(
p
,
q
) actually is a halfplane. See Figure 17.13. In fact, it
is the halfplane containing
p
determined by the perpendicular bisector of the segment
[
p
,
q
], that is,
-
+
pq
Ó
Ê
Ë
ˆ
¯
˛
(
)
=Œ
2
h
p q
,
r
R
pq
•
r
£
0
.
2
This fact follows easily from the identity
2
2
p
+
q
pr
-
rq
Ê
Ë
ˆ
¯
pq
•
r
-
=
.
2
2
Now let
S
be a finite set of points in
R
2
. The elements of
S
will be called
sites
.
Definition.
The
Voronoi cell of a point
p
in
S
, denoted by V(
p
), is defined by
I
()
=
(
)
V
p
h
p,q
.
Œ-
{}
qS p
Figure 17.13.
A halfplane h(
p
,
q
).