Graphics Reference
In-Depth Information
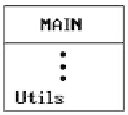
Activating the Utils item should bring up the menu
that allows the user to change the current dimensions of the window, to change the location of
the viewport on the screen, and to toggle the display of the window's dimensions, respectively.
If the window dimension display has been toggled to be on, then it should stay on the screen
no matter which menu is the current one. Let the default window be [-10,10] ¥ [-10,10]. Keep
in mind though that the window dimensions can be arbitrary real numbers. It is the viewport
dimensions that are always integers. One way to display the window dimensions would be as
follows:
In this project there are no objects to display but it can be tested by drawing viewports
with a background that has a color different from the rest of the screen and checking the dimen-
sions that are displayed.
1.5.2 Graphing functions
The object of this project is to try out some line drawing commands. Specifically, you are to draw
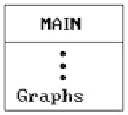
a linear approximation to the graph of some functions. Add another item to the main menu:
The idea is to evaluate a given function at a finite set of values in its domain and then to draw
the polygonal curve through the corresponding points on its graph. See Figure 1.8. Let a user
specify the following:
(1)
The interval [a,b] over which the function is to be graphed.
(2)
The “resolution” n, meaning that the function will be evaluated at a + i (b - a)/n, 0 £ i £ n.


