Information Technology Reference
In-Depth Information
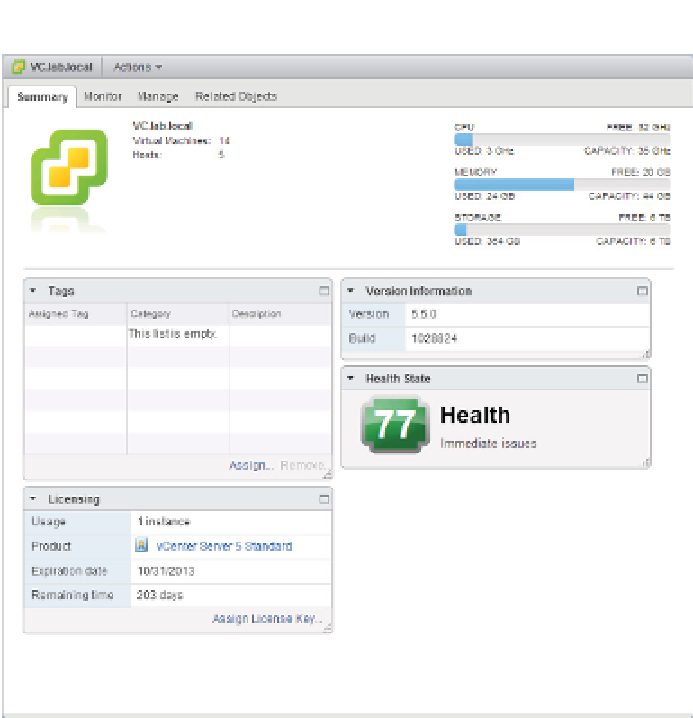
Figure 13.14
vCenter Operations
Manager integrates
with the vSphere
Web Client to show
health information
about the currently
selected object, in
this case the vCen-
ter server itself.
Health is a top-level indicator made up of the subcomponents faults, workload, and anoma-
lies. Faults have the most weight when calculating the overall health badge because they are
problems that are happening right now. Workload and anomalies are combined to assist with
understanding current performance characteristics. As you can probably imagine, all of these
components have their own subcomponents too, but how everything is calculated behind the
scenes is not relevant for this discussion. The health badge gives an overall view of how an
object within vCenter is performing and is calculated every 5 minutes. If the health monitor
spots a problem, you can dive in to i nd out the cause. We'll now explain the last tool in the
toolbox, resxtop, and then we'll show you how to combine all of the tools to keep your environ-
ment in top condition.
Working with
resxtop
In addition to alarms and performance charts, VMware provides resxtop to help monitor per-
formance and resource usage. In early ESX versions, several tools were available on the service
console command line. Later, VMware released ESXi and limited the number of commands avail-
able directly on the host but developed a special virtual appliance that provides a command-line
interface for managing ESX and ESXi hosts called the vSphere Management Assistant (vMA). You