Information Technology Reference
In-Depth Information
Setting a Custom Interval
Just as with the Overview layout, within each of the resource types, you have a choice of inter-
vals to view. Some objects offer a Real-Time option; this option shows what is happening with
that resource right now, with a historical view over the past hour, and the charts automatically
refresh every 20 seconds. The others are self-explanatory in their time span, but note that they
do not refresh automatically. The Custom option allows you to specify exactly what you'd like to
see on the performance chart. For example, you could specify that you'd like to see performance
data for the last 8 hours. Having all of these interval options allows you to choose exactly the
right interval necessary to view the precise data you're seeking.
Managing Chart Settings
There's one more area of the Chart Options dialog box that we'll discuss, and that's the Chart
Options drop-down and Save Options As button along the top.
After you've gone through and selected the resource type, display interval, objects, and per-
formance counters that you'd like to see in the performance chart, you can save that collection
of chart settings using the Save Options As button. The vCenter Web Client prompts you to
enter a name for the saved chart settings. After a chart setting is saved, you can easily access it
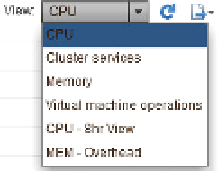
again from the drop-down list at the top of the performance chart Advanced layout. Figure 13.13
shows the View drop-down list, where two custom chart settings—CPU-8hr View and MEM -
Overhead—are shown. By selecting either of these from the View drop-down list, you can
quickly switch to those settings. This allows you to dei ne the performance charts that you need
to see and then quickly switch between them.
Figure 13.13
You can access
saved chart set-
tings from the View
drop-down list.
If you have a custom chart saved, the Chart Options dialog box allows you to delete chart set-
tings you've saved but no longer need.
In addition to offering you the option of saving the chart settings, vCenter Server also allows
you to save the chart.
Exporting Performance Charts
When we i rst introduced you to the Advanced layout view of the Performance tab, we briel y
mentioned the Export button. This button, found in the upper-right corner of the Advanced
layout, allows you to save the results of the performance chart to an external i le for long-term
archiving, analysis, or reporting.
When you click the Export button, a standard Save dialog box appears. You have the option
of choosing where to save the resulting i le as well as the option of saving the chart either as a
graphic i le or as a comma-separated values (CSV) i le. If you are going to perform any additional