Information Technology Reference
In-Depth Information
counters selected are measured in percentages and megahertz. Depending on the counters
chosen, there may be only one unit of measurement, but there will be no more than two. Next,
on the horizontal axis, is the time interval. Below that, the performance chart legend provides
color-coded keys to help the user i nd a specii c object or item of interest. This area also breaks
down the chart into the object being measured; the measurement being used; the units of mea-
sure; and the Latest, Maximum, Minimum, and Average measurements recorded for that object.
Hovering the mouse pointer over the chart at a particular recorded interval of interest dis-
plays the data points at that specii c moment in time. Another nice feature of the charts is the
ability to emphasize a specii c object so that you can more easily select this object from other
objects. Clicking the specii c item in the chart legend at the bottom will emphasize the object
and its representative color .
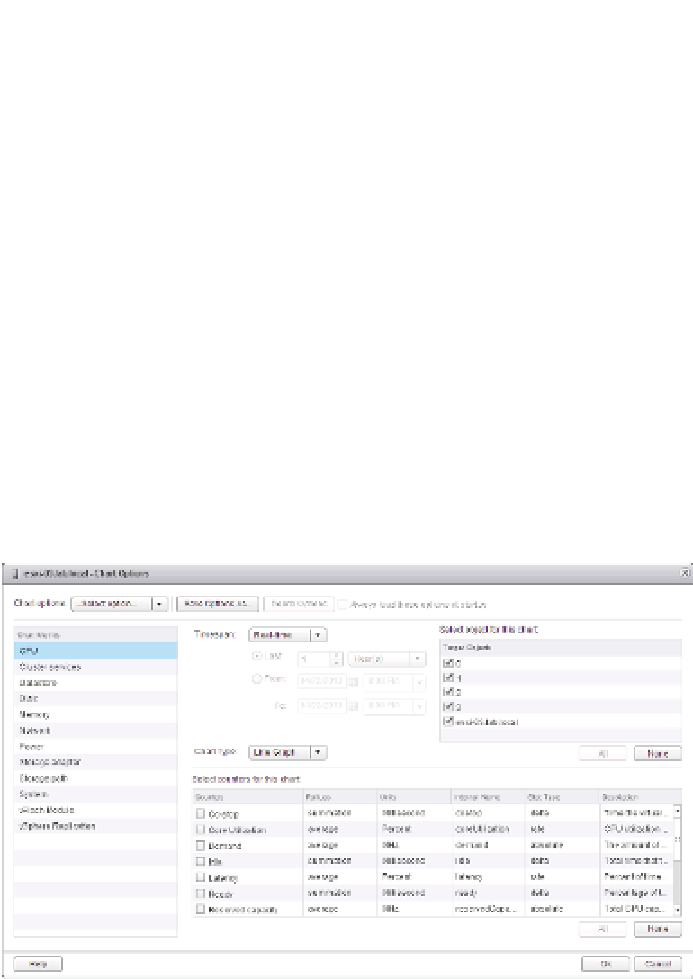
Now that you have a feel for the Advanced layout, let's take a closer look at the Chart Options
link. This link exposes vCenter Server's functionality in creating highly customized perfor-
mance charts and is where all the nuts and bolts are coni gured for this feature. Figure 13.12
shows the Chart Options dialog box. This dialog box is the central place where you will come to
customize vCenter Server's performance charts; you can also just double-click the chart to dis-
play this dialog box. From here, you select the counters to view, the time ranges, and the kind of
chart (Line Graph or stacked graph) to display.
Figure 13.12
h e Chart Options
dialog box off ers tre-
mendous fl exibility
to create exactly the
performance chart
you need.
Because there is so much information available in the Chart Options dialog box, we've
grouped the various options and types of information into the sections that follow.
Choosing a Chart Metrics and Counters
On the left side of the Chart Options dialog box (shown in Figure 13.12), you can choose which
metric to monitor or analyze. All the available chart metrics are listed here, but only a subset of
these are available, depending on the object selected to monitor:
CPU
◆
Cluster Services
◆
Datastore
◆