Information Technology Reference
In-Depth Information
last hour of data and automatically refreshes every 20 seconds, while the other time range set-
tings do not automatically refresh.
Below these controls are the actual performance charts. The layout and the charts that are
included vary based on the object selected and the option chosen in the View drop-down list.
While we don't have the room to list all of them, we show you two examples, in Figure 13.9 and
Figure 13.10. I encourage you to explore and i nd the layouts that work best for your environ-
ment and, more important, layouts that clearly show you the performance information you
require.
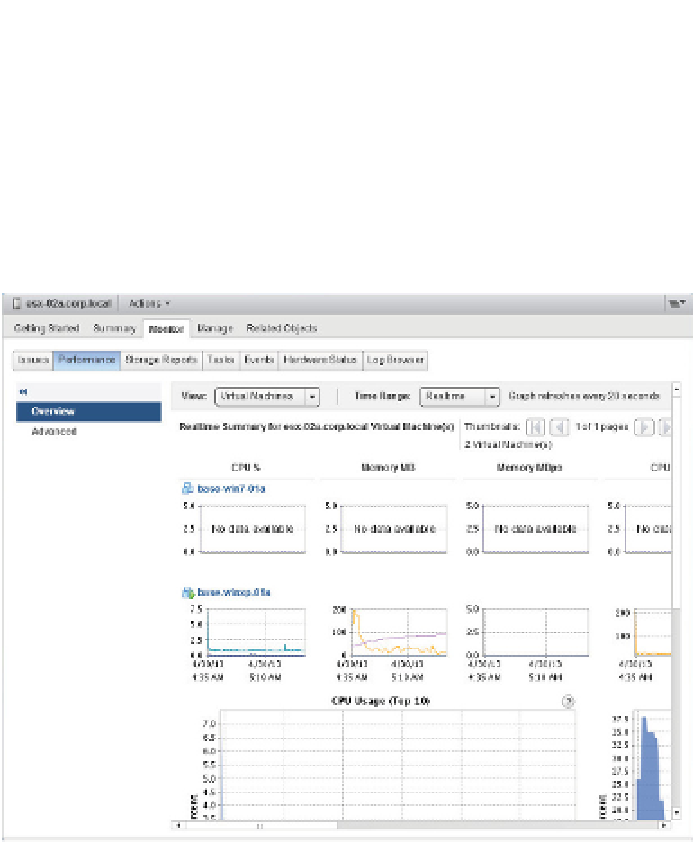
Figure 13.9
h e Virtual
Machines view of
the Performance
tab for an ESXi host
in Overview layout
off ers both per-
VM and summary
information.
The Overview layout works well if you need a broad overview of the performance data for a
datacenter, cluster, resource pool, host, or VM. But what if you need more specii c data in a more
customizable format? The Advanced layout is the answer, as you'll see in the next section.
Advanced Layout
Although it's called the Advanced layout, to begin with it looks somewhat simpler than the
Overview layout. There is only a single chart within this view, but don't let this fool you because
there are a signii cant number of coni guration options for this lone performance chart.
Figure 13.11 shows the Advanced layout of the Performance tab for a cluster of ESXi hosts.
Here, in the Advanced layout, is where the real power of vCenter Server's performance charts is
made available to you.