Environmental Engineering Reference
In-Depth Information
values ranges from 1.44 to 4.26 meq/l (pre-) & 2.19 to 3.60 meq/l (post-) whereas in
theCa
2+
-Na
+
-HCO
3
−
faciesCa
2+
values ranges from 2.75 to 3.35 meq/l (pre-) & 1.96
to 3.51 meq/l (post-), and Na
+
values ranges from 2.42 to 2.74 meq/l (pre-) & 1.71 to
1.92 meq/l (post-) (Table
3
). Average TDS value for the Na
+
-Ca
2+
-Cl
−
water type is
894 mg/l in pre- and 851 mg/l in post-monsoon. The Ca
2+
-Na
+
-HCO
3
−
(average
TDS = 327 mg/l in pre- and 292 mg/l in post-monsoon) and Na
+
-Ca
2+
-HCO
3
−
(average
TDS = 432 mg/l in pre- and 424 mg/l in post-monsoon) type waters are less mineral-
izedthantheothertypeofgroundwaters.Hydrogeochemistryismodiiedprimarily
due to the sluggish movement of groundwater and dominant ion-exchange process in
pre- and post-monsoon seasons in the study area.
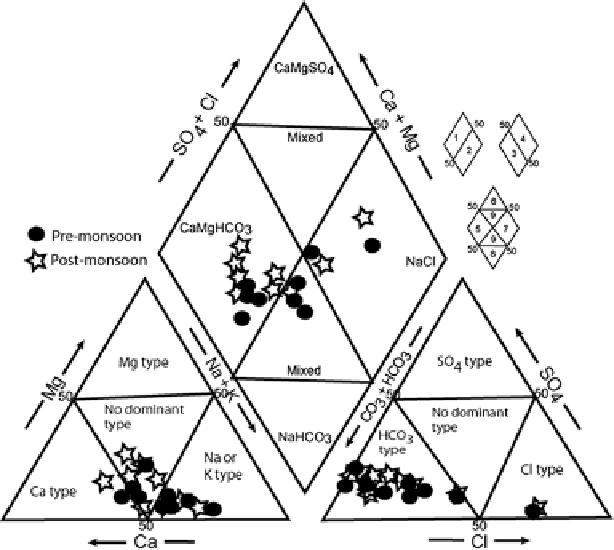
Hydrochemical data was presented in various graphical plots to identify hydro-
geochemical processes responsible for enhancement of salinity in the study area.
Hydrochemical concepts can help to elucidate the mechanisms of flow and transport
in groundwater systems, and unlock an archive of paleo-environmental information
(Hem
1992
; Pierre et al.
2005
). The facies can be classified on the basis of dominant
ions using the Piper's trilinear diagram. The concentrations of major ionic constitu-
ents of groundwater samples were plotted in the Piper trilinear diagram (Piper
1953
)
to determine the water type (Fig.
2
). The classification for cation and anion facies,
in terms of major ion percentages and water types, is according to the domain in
which they occur on the diagram segments (Raju et al.
2009
).
Fig. 2
Trilinear diagram showing the relative cation and anion composition of groundwater
samples (After Piper
1953
)
Search WWH ::

Custom Search