Environmental Engineering Reference
In-Depth Information
79 23' 05”
79 38' 20”
N
13
13
38
'
38'
29”
29”
TSP Classified
Location
Excellent
Good
13
13
36
'
36
'
23”
23”
79
23' 05”
375 750
1,500
2,250
3,000
Meters
79 38' 20”
0
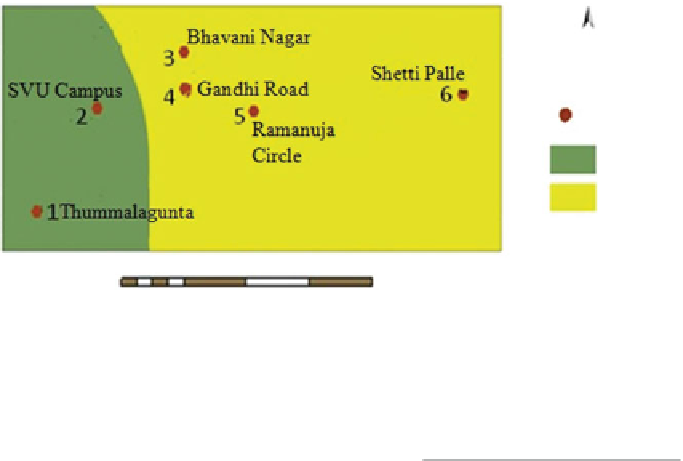
Fig. 11
Classifi ed map of TSP
Table 3
Statistical results for
TSP classifi ed map
Area
(km
2
)
Class
Excellent
9.87
Good
26.56
Grand total
36.44
from Fig.
11
, the quality of air is well below the standards proposed by NAAQS
(
1994
). The locations such as SVUC and TG lie under the 'excellent' category.
These locations are away from traffi c and also industrial activities, whereas, other
sampling locations BN, GR, SP and RC are under the 'good' category. Even though
these sampling points are located nearby traffi c and small scale industries, the overall
quality of air is not affected much. The statistical results of the classifi ed map are
given in Table
3
. It is evident from Table
3
that out of 36.44 km
2
study area 9.87 km
2
is found to be excellent quality, whereas 26.56 km
2
area is found to be good quality.
Conclusions
Continuous increase of urban air pollution now becomes a bigger challenge to urban
planners, policy makers and health offi cials. There is a need for continuous monitor-
ing of air pollution levels and also make the information obtained available to pub-
lic. Present study provides data instantly in a comprehensive form and also it is easy
to analyze the impact of pollutant on particular geographical area. Our results show
that the study area does not exceed the standards suggested by NAAQS. TSP classi-
fi ed map shows that the overall quality of air fall under two categories i.e. excellent
and good. Since present study is fi rst in its kind in the study region Tirupati, the
obtained results provides base for future researcher and planning offi cials.


Search WWH ::

Custom Search