Environmental Engineering Reference
In-Depth Information
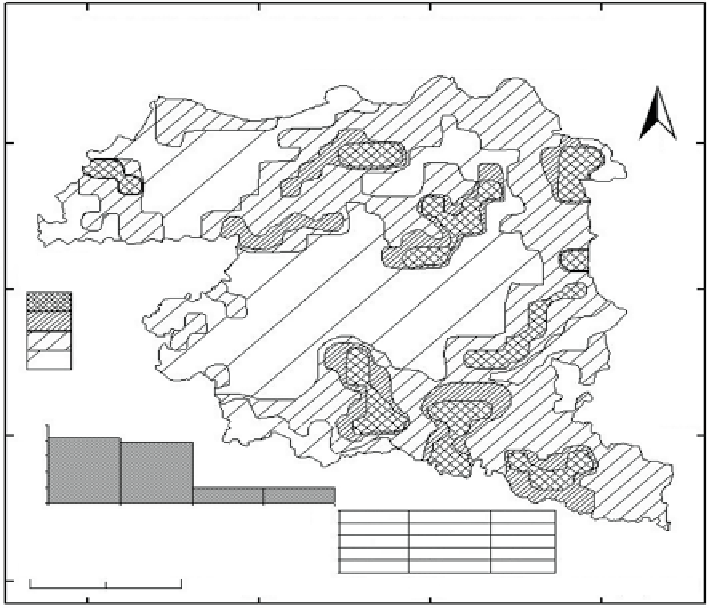
FREQUENCY OF SURFACE WATER BODIES
Ausgram Block I & II Burdwan District
N
23
35'N
No of Surface
Water Bodies/ Sq.Km
23
30'N
> 15
10 - 15
02 - 10
<2
50
40
30
20
10
0
23
25'N
Area in %
41.62
38.86
09.48
10.04
<2
2--10
10--15
>15
FSWB
Area in sq.km
<2
205.20
191.60
46.72
49.48
Surface Water Bodies per sqkm
2-10
10-15
0
4
8
Km
>15
87
35'E
87
40'E
Fig. 6
Frequency of surface water bodies map (
Source
: 73 M/10, 11, 14 & 15)
With the help of the above criteria and methodology (Table
1
), the surface water
harvesting potential zones are identified and classified in three categories i.e.
Maximum Surface Water Harvesting Potential Zone, Moderate Surface Water
Harvesting Potential Zone and Minimum Surface Water Harvesting Potential Zone
of Ausgram blocks I and II (Fig.
7
).
Maximum Surface Water Harvesting Potential Zone covered 13 % of land surface
and is distributed in central, south east, north west and north east parts of the study
area. Moderate Surface Water Harvesting Potential Zone covered 6 % of the land
surface and is distributed in north west, south central, south east parts of the study
area. Minimum Surface Water Harvesting Potential Zone or not suitable for surface
water storage covered 81 % of the land surface and is distributed in maximum study
area land; because these 81 % land have rough topography, covered by minimum
surface water bodies and drainage density, it is poorly suitable for water storage.
The surface water potential zone map (Fig.
7
) shows maximum area affected by
water stressed problem (around 81 %). Generally this study concludes that surface
water resource is poor in the study area.
Search WWH ::

Custom Search