Biology Reference
In-Depth Information
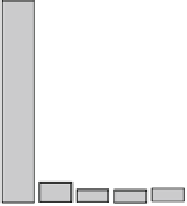
Number of changepoint
− target gene: 1 −
Changepoint position
− target gene: 1 −
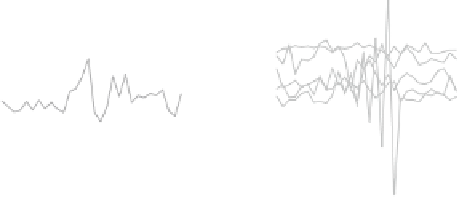
Target gene expression profile
Parent gene expression profiles
1.0
1.0
5
5
0.8
0.8
0
0
0.6
0.6
0.4
0.4
−5
−5
0.2
0.2
−10
−10
0.0
0.0
0
5
10
15
20
25
30
012345
0
5
10
15
20
25
30
0
5
10
15
20
25
30
Changepoint number
( max. value = 1 )
Time point
Time point
Time point
( # of selected changepoint(s) = 1 )
Regulatory model for target gene: 1
Temporal segment # 1 : [ 2 , 10 ]
Regulatory model for target gene: 1
Temporal segment # 2 : [ 11 , 30 ]
Sub−network # 1
( time point 2 to 10 )
Sub−network # 2
( time point 11 to 30 )
1.0
1.0
TF5
TF5
0.8
0.8
TF2
TF2
TF1
TF1
0.6
0.6
1
1
0.4
0.4
TF4
TF4
0.2
0.2
TF3
TF3
0.0
0.0
TF1
TF2
TF3
TF4
TF5
TF1
TF2
TF3
TF4
TF5
Positive interaction
Negative interaction
Positive interaction
Negative interaction
Parent genes
# of selected edge(s): 0
Parent genes
# of selected edge(s): 1
Fig. 3.8
Graphical outputs obtained from the
ARTIVA
package. Results presented here were obtained analyzing the simulated data sets
data(simulatedData)
available in the
ARTIVA
package, applying function
ARTIVAsubnet
. The TF3 was considered simultaneously as parent and
target, thus allowing the identification of an auto-regulation mechanism


Search WWH ::

Custom Search