Biology Reference
In-Depth Information
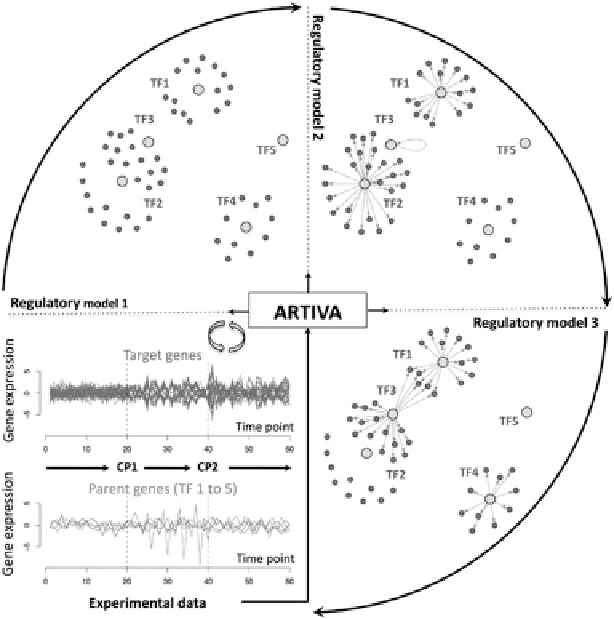
Fig. 3.3
Time-varying structures of some gene regulation networks learned with ARTIVA. 50
targets (
dark grey
) and 5 transcription factors (parents,
light grey
) are modeled in each network.
From an exploratory analysis of the gene expression profiles of the parents and the targets (
bottom
left panel
), three temporal phases are identified and delimited by the changepoints CP1 and CP2
(
dashed lines
). The regulatory models for the different temporal phases are represented clockwise
in the
top left
,
top right
,and
bottom right
panels. The plots of the networks around each parent
were obtained using the IGRAPH library (
Csardi and Nepusz 2006
). Note that a variable can be
simultaneously parent and target, thus allowing the identification of auto-regulation mechanisms
as shown here for TF3 (regulatory model 2)
where
•
ε
(
represents the experimental noise and is assumed to follow a
p
-dimensional
Gaussian distribution with zero mean and covariance matrix
t
)
diag
(
σ
2
,
i
Σ
=
)
h
2
ε
i
(
t
)
∼
N
(
0
,
(
σ
i
)
)
;
B
h
•
represents the baseline value of the variables
X
1
(
t
)
,...,
X
p
(
t
)
in phase
h
and
does not depend on the parents activities;
A
h
p
matrix such that the coefficient
a
ij
represents the regulatory
interaction between the target
X
i
and the parent
X
j
in phase
h
.
a
ij
)
•
=(
is a
p
×
Search WWH ::

Custom Search