Biology Reference
In-Depth Information
Perch Height (Sagrei)
Perch Height (Distichus)
120
140
100
100
80
80
60
60
40
40
20
20
0
0
high
low
high
low
Perch Diameter (Sagrei)
Perch Diameter (Distichus)
120
100
100
80
80
60
60
40
40
20
20
0
0
narrow
wide
narrow
wide
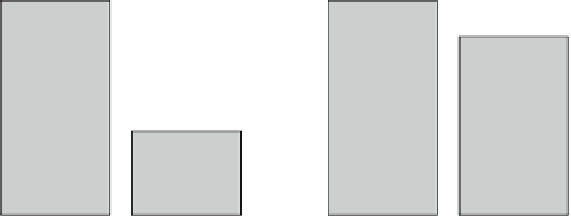
Fig. 1.3
Barplots for the perch height and diameter of
sagrei
and
distichus
lizards
are considering. A simple way to plot the frequencies associated with
Height
and
Diameter
for each species is to use a
barplot
.
> Sagrei.lizards =
+ lizards[lizards$Species == "Sagrei", ]
> Distichus.lizards =
+ lizards[lizards$Species == "Distichus", ]
> par(mfrow = c(2, 2))
> plot(Sagrei.lizards[, "Height"],
+ main = "Perch Height (Sagrei)")
> plot(Distichus.lizards[, "Height"],
+ main = "Perch Height (Distichus)")
> plot(Sagrei.lizards[, "Diameter"],
+ main = "Perch Diameter (Sagrei)")
> plot(Distichus.lizards[, "Diameter"],
+ main = "Perch Diameter (Distichus)")
Figure
1.3
shows the plot generated be the commands above. The first two com-
mands extract from the data set the subsets of observations corresponding to each
species.
par
is then used to split the plot area into four quadrants, arranged in a lay-
out with 2 rows and 2 columns. Each quadrant holds one of the barplots, which are


Search WWH ::

Custom Search