Graphics Programs Reference
In-Depth Information
Again, keep in mind that tone is separate from color. All you should care about at
this stage is how light or dark a particular part of the photo should be. Use your
intuition and trust your eyes. Take as much time as necessary to get the tones
right and the remainder of processing becomes easier.
4
⌘
+0 or Ctrl+0
Open and close
the istogram
panel
HISOGRAM
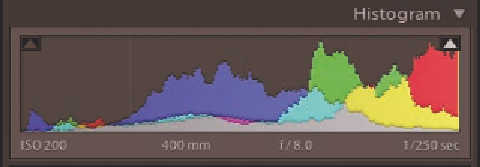
h e Histogram (see Figure 4-32) is a bar graph showing the distribution of tonal
values in the image. h e black point is at the let side of the horizontal axis; the white
point is at the right. Midtones are at the middle of the horizontal scale. h e values
displayed on the vertical axis represent the relative number of pixels at each tonal level.
h ere is no such
thing as a “correct”
istogram. As every
image is dif erent,
every istogram will
be unique. However,
the shape of the
Histogram can help you make decisions about how to process the tones in an
image. Usually, the width of the data shown in the Histogram is more important
than the height; the Histogram for an image with a wide tonal range will show
data distributed over the length of the horizontal axis, whereas a photo with
limited dynamic range will show all the data clustered in one area of the graph.
Figure 4-32
h e colors in the Histogram represent pixel values for each of the r gb channels
and their complements: cyan, magenta and yellow. Gray represents areas of
overlapping pixel values for all three channels.
As you move your cursor within the Histogram, tone ranges are illuminated
that correspond with the Tone sliders in the Basic panel (which also become
illuminated).
At the bottom of the Histogram is an information display. Its default state shows
key settings of the capture. As you move your cursor over the photo the readout
changes to show the values for each channel, in percentages. (In Lightroom's color
model, pure white is 100% and pure black is 0%.)
h e Histogram in Lightroom 3 is now “animated”; as you switch from one photo
to another in Develop or Library, the Histogram dynamically updates as the
photo is loaded. h is helps evaluate minor dif erences in Histogram data between
photos whose previews appear very similar.


Search WWH ::

Custom Search