Environmental Engineering Reference
In-Depth Information
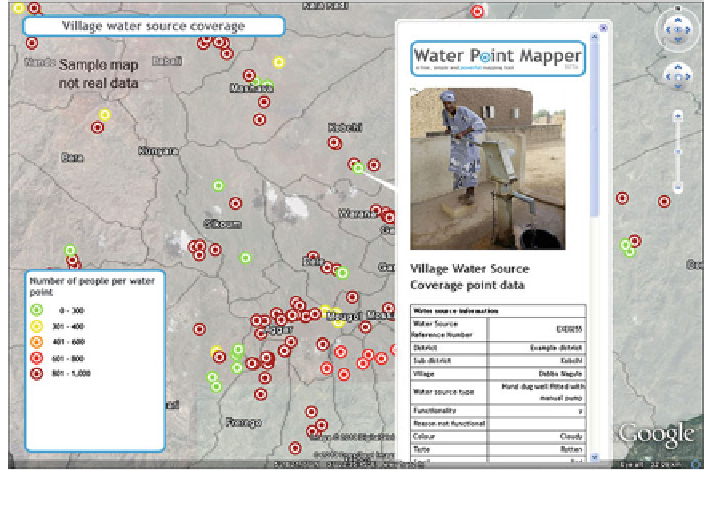
Fig. 9 Water Point Mapper produced map of village water source coverage.
Source
WaterAid
priority. Here, capacity building for water resources management in the best sense
of the word (cf. Ardakanian and Liebe
2012
) can be materialized (cf. also Gan et al.
2013
).
Collected data from varying sources can be managed and presented in a user-
friendly format by a GIS system (Sect.
2.6.1
). The data might be integrated within a
VGE framework to account for the need for future system response predictions.
3 Conclusion
In many developing countries such as main parts of Africa, data scarcity is an issue.
Considering their
financial as well as personal limitations, cost-effective data
assimilation methods should be applied. Additionally, smart technologies that allow
the public to participate in the data acquisition process should be taken advantage
of. These technologies include, for example the use of mobile phone services such
as within the WPM process.
In this chapter, we elaborated on the general workflow from data to visualization
of water services in the context of informing decision-makers about the status and
development of water services, thereby enabling them to implement good and
adequate water governance. The examples provided focus in particular on water
management in Africa. Since any modelling and visualization is only as good as the
Search WWH ::

Custom Search