Information Technology Reference
In-Depth Information
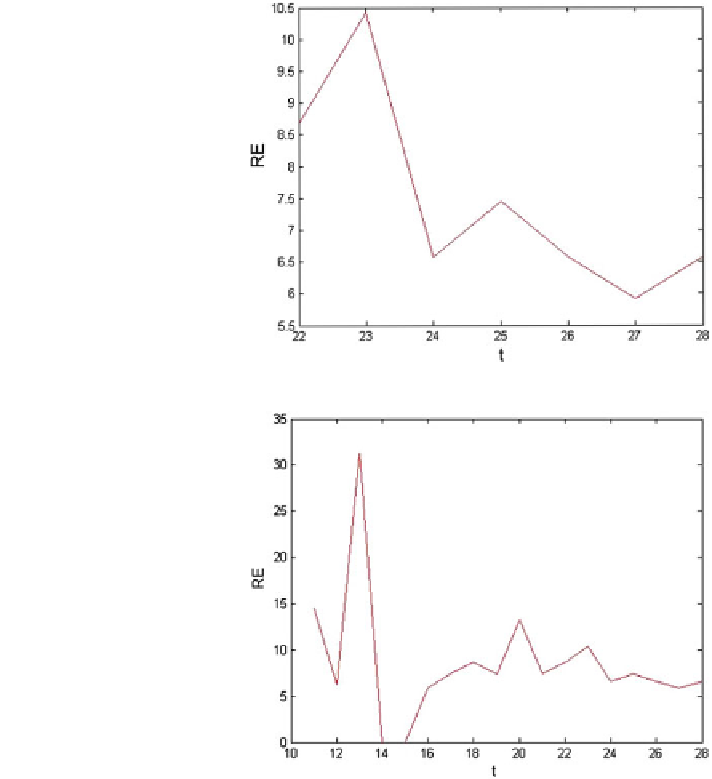
Fig. 8 RE versus t (1st phase
version)
Fig. 9 RE versus t (2nd
phase version with time
estimation as variable)
application. Sample normalization has been denoted with different color represen-
tation. It has been observed that there is few overlapping status over test iterations
of 12 weeks. The generic plot for the code is given Appendix (Fig.
10
).
5.3.1 Comparative Approaches of ML: SVM Classification Plot Versus
Regression Based ML
Encountering the contemporary methodologies of ML, for reliability measures of
software components, it has been emphasized that the classi
cation of faults or
defects can be expressed as general multivariate logistic regression formula, which
is as follows (Aggarwal et al.
2009a
):
Search WWH ::

Custom Search