Information Technology Reference
In-Depth Information
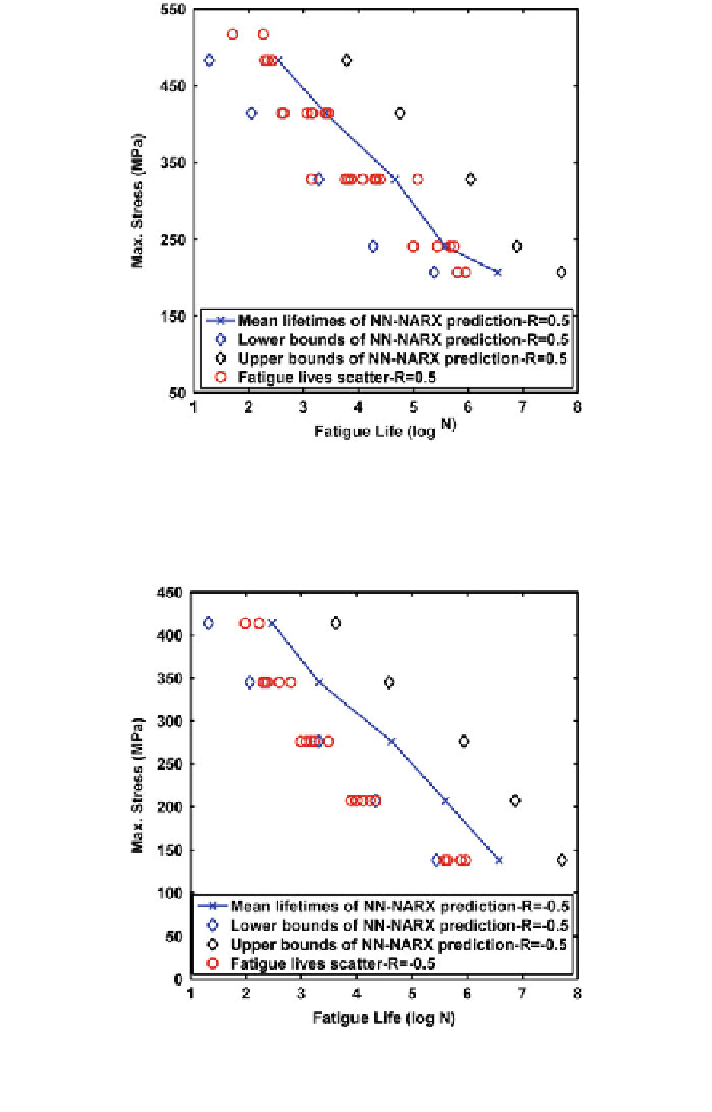
Fig. 26 Fatigue lives scatter for E-glass/polyester ([90/0/
45/0]
S
) from experiments (Mandell and
Samborsky
2010
) along with the upper and lower bounds of NN-NARX model prediction for the
stress ratio R = 0.5
±
Fig. 27 Fatigue lives scatter for E-glass/polyester ([90/0/
±
45/0]
S
) from experiments (Mandell and
Samborsky
2010
) along with the upper and lower bounds of NN-NARX model prediction for the
stress ratio R =
−
0.5
Search WWH ::

Custom Search