Information Technology Reference
In-Depth Information
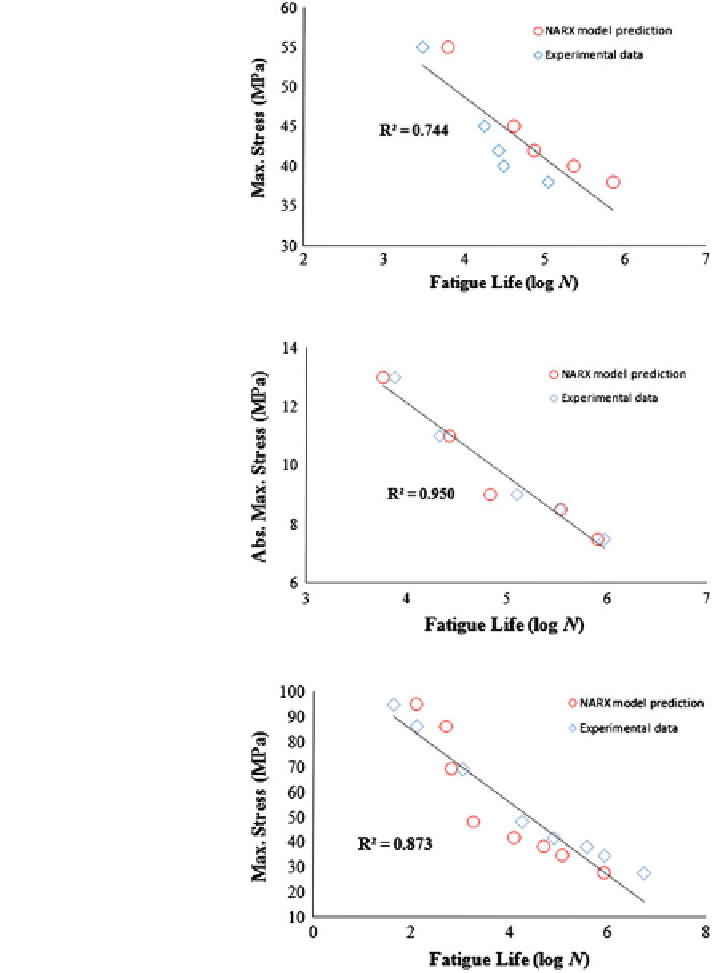
Fig. 20 S-N curves obtained
by the NN-NARX model and
the experimental data for
R =
−
1:
ʸ
=90
°
of
E-glass/polyester
Fig. 21 S-N curves obtained
by the NN-NARX model and
the experimental data for
R = 10:
ʸ
=30
°
of
E-glass/polyester
Fig. 22 S-N curves obtained
by the NN-NARX model and
the experimental data for
R =
of
E-glass fabrics/epoxy
−
2:
ʸ
=90
°
for stress ratios R =
, respectively. Note that the NN
simulation results were selected and presented because the results respectively
corresponded to the lowest and the highest of R
2
−
2:
ʸ
=90
°
and R = 0.5:
ʸ
=90
°
values which represent
the
“
goodness
”
of the NN-NARX model in modeling fatigue lives for the problem
considered.
Search WWH ::

Custom Search