Information Technology Reference
In-Depth Information
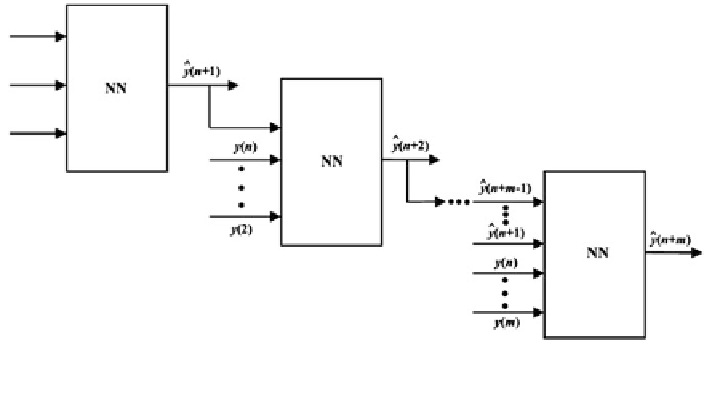
Fig. 5 Spectrum fatigue life prediction made up by one-step ahead prediction using NN with
NARX-series parallel structure
4.3.2 Spectrum Fatigue Life Prediction
Fatigue life assessment of the materials was performed and realized as one-step
ahead prediction with respect to each stress level S corresponding to stress ratio
values R arranged in such a way that transition took place from a fatigue region to
another one in the CLD. Figure
5
describes the lifetime assessment process using
NN with NARX model in the study.
Using the methods described previously, all simulation results of fatigue life
assessment of the composite materials are presented and discussed in following
sections.
5 Simulation Results and Discussion
5.1 Fatigue Life Assessment of Multivariable Amplitude
Loadings with MLP-NARX Model
Here, E-glass/polyester of [90/0/
±
45/0]
S
, E-glass/polyester of [0/(
±
45)
2
/0]
T
whose
on-axis orientation, E-glass/polyester of [0/(
±
45)
2
/0]
T
whose 45
°
orientation are
denoted as Material I, Material II-on-axis and Material II-45
, respectively.
Figures
6
,
7
,
8
,
9
,
10
,
11
and
12
show the S-N curves obtained by the NN-NARX
model and the experimental data for the tested stress ratios R = 0.9, 0.8, 0.7, 0.5,
−
°
0.5,
−
1 and
−
2 of Material I, respectively. Note that the NN fatigue life prediction
results of R =
−
0.5 in Fig.
10
represented
“
the worst prediction
”
, while those of
R = 0.7 in Fig.
8
represented the best one.
Search WWH ::

Custom Search