Information Technology Reference
In-Depth Information
Table 3 Optimization results
from 20 trials of problem
(1.1): ISE criterion
Algorithm
Best
Mean
Worst
ST deviation
DSA
0.1621
0.1691
0.1760
0.0045
GSA
0.1556
0.1710
0.1800
0.0193
ABC
0.1928
0.2274
0.2322
0.0134
PSO
0.1600
0.1715
0.1802
0.0140
GAO
0.1643
0.1722
0.1799
0.0086
Table 4 Optimization results
from 20 trials of problem
(1.1): MO criterion
Algorithm
Best
Mean
Worst
ST deviation
DSA
0.0365
0.0722
0.1307
0.0277
GSA
0.0307
0.0624
0.0096
0.0315
ABC
0.1305
0.1550
0.1972
0.0412
PSO
0.0422
0.0936
0.1420
0.0511
GAO
0.0411
0.0913
0.1300
0.0373
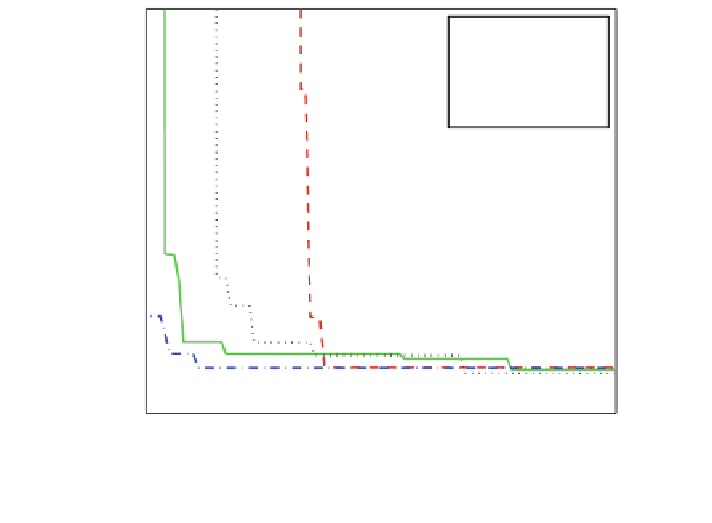
p
1
=0.3; p
2
=0.3
p
1
=0.1; p
2
=0.1
p
1
=0.1; p
2
=0.2
p
1
=1.5; p
2
=2.0
0.3
0.25
0.2
0.15
0
20
40
60
80
100
Iteration
Fig. 5 Robustness convergence under control parameters variation of the DSA-based approach:
ISE criterion case
In this case study, we tested the proposed algorithms with different values of the
population size in the range of [20, 50]. Globally, all the results found are close to
each other. The best values of this control parameter are usually obtained while
using a population size equal to 30.


Search WWH ::

Custom Search