Information Technology Reference
In-Depth Information
Table 6 Unitary costs, self consumption percentages (SC) and CBA results (NPV and IRR) for
the considered case study with and without energy management actions
No EM actions
EM actions
3
-
57
-
9 Size
Cost (
/
SC
(%)
NPV
(
IRR
(%)
SC
(%)
NPV
(
IRR
(%)
€
(KWp)
KWp)
)
)
€
€
1.00
3,850
41.1
787
7.91
53.4
1,005
8.64
1.25
3,750
35.3
937
7.85
47.3
1,208
8.60
1.50
3,500
31.3
1,251
8.35
42.9
1,566
9.11
1.75
3,150
27.4
1,711
9.28
38.5
2,067
10.07
2.00
2,950
24.2
2,048
9.71
35.2
2,443
10.51
2.25
2,750
22.5
2,069
9.47
32.9
2,501
10.30
2.50
2,700
20.6
1,730
8.51
30.6
2,198
9.36
2.75
2,500
19.4
1,716
8.42
29.4
2,215
9.32
3.00
2,450
17.5
1,363
7.60
26.9
1,888
8.51
3.25
2,320
16.2
1,310
7.46
25.8
1,879
8.44
3.50
2,260
15.7
1,047
6.89
24.7
1,624
7.85
Figure
15
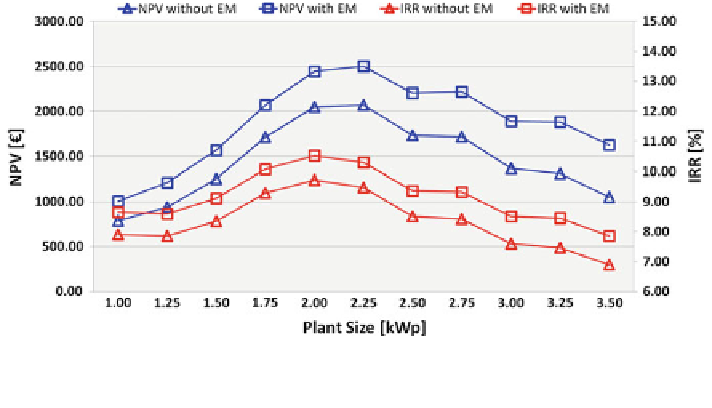
shows the trend of NPV and IRR depending on the PV plant size when
a user do not perform any EM action. The values of NPV, which range between 790
and 2,070
, IRR, between 6.89 and 9.71 %, show better results for a 2.25 KWp
plant. In particular revenues decrease from 2,070 to 1,360
€
with a 3 KWp plant and
IRR decrease of 2 %, emphasizing the need of the correct sizing of the plant.
We have furthermore analyzed the situation in which the user performs basic EM
actions (starting the 2 main shiftable appliances around the peak production hours
of each day, according to the results provided by the energy management algo-
rithms presented).
€
Fig. 15 Results of the cost benefits analysis. NPV (blue line) and IRR (red line) for the different
sizes of PV plants computed when a user performs EM actions (squared markers) or maintains the
same energy behavior (triangular markers)


Search WWH ::

Custom Search