Information Technology Reference
In-Depth Information
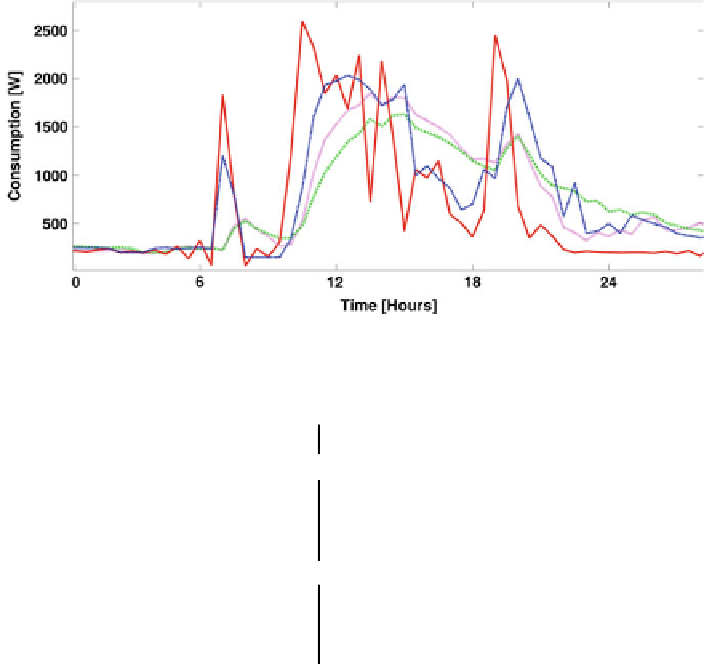
Fig. 12 The continuous red line is the measured consumption, the dashed blue line is the 3 h
ahead forecast, the dotted purple line and green line are respectively the 8 and 18 h ahead forecast
Table 5 RMSE and
percentage error between
electrical consumption and
PV production predicted and
measured for the 3 considered
houses
RMSE
SD (W)
ERR %
Consumption (h)
3
182.7 Wh
128.4
9.70
8
246.6 Wh
198.2
12.20
18
334.8 Wh
302.1
16.30
PV production (h)
3
0.167 KWh
98.4 Wh
7.70
8
0.247 KWh
173.1 Wh
9.30
18
0.371 KWh
296.7 Wh
11.80
s necessary to maximize
PV production self-consumption, often shifting the start time of some appliances.
Users should be informed about instantaneous and forecasted energy consumption
and production to make the right decisions. Due to the occupancy pro
In the Italian scenario to minimize energy payment it
'
le of the
dwellings during working hours, this policy can
it easily be adopted and it is nec-
essary the remote start of some appliances, under user de
'
ned parameters (type of
appliance to start, maximum end time, cycle time).
The algorithm used to plan the better time to start an appliance is based on: price
of energy P(k), production and consumption forecasted each 30 min P
PV
(k) and
C
0
(k), feed-in tariffs
(for PV plants installed before July 2013), appliance energy
consumption each 30 min C
1
(k), end time of the cycle H and cycle time J. Elec-
tricity prices are assumed to take two levels, corresponding to peak and off-peak
hours (the typical Italian scenario). During the peak period, from 8:00 a.m. to 7:00
p.m., from Monday to Friday (for the typical domestic contract) electricity costs
0.23 eur/kWh, and at all other times it costs 0.21 eur/kWh (these are actual rates
from Enel time-of-use pricing model in Italy). In absence of a PV plant and without
ʴ


Search WWH ::

Custom Search