Information Technology Reference
In-Depth Information
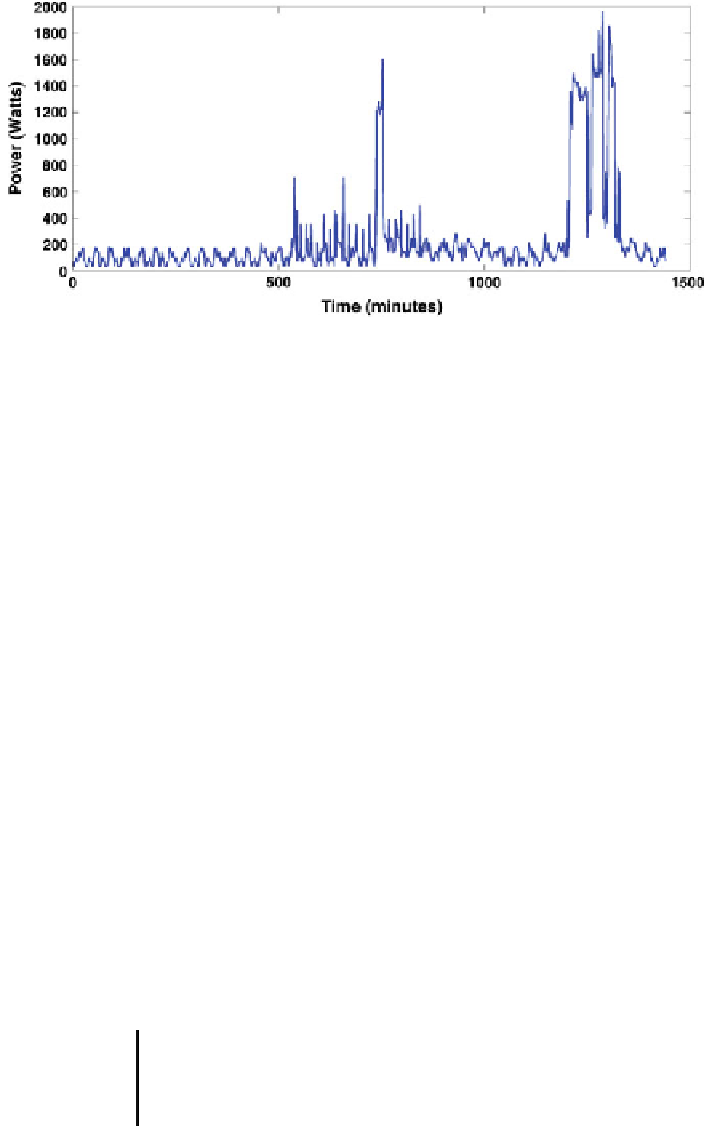
Fig. 6 1 min Resolution consumption for one of the considered households in Ripatransone (AP),
Italy on a spring day (March 12 2012). One the x-axis are represented the minutes in a day
each appliance the most similar pro
le in the database (e.g. same brand for the
dishwasher, same size for the TV or the laptop battery charger).
It is important to emphasize that the differences between single appliance blocks
for the different dwellings are taken into account changing the fuzzy rules, the
occupancy pro
le and using different consumption patterns from the database
(according to the different appliances).
The
final aim of this simulation tool is the prediction of the human behavior (e.g.
the starting of an appliance within 1 h of its real start) especially during daylight
periods, in order to give a good method to correctly design a PV plant and evaluate
Energy Management actions bene
ts.
Consequently the purpose of the following validation is to show that the mea-
sured and simulated data have similar statistics and differ only for limited quantities.
To this end, the model was used to create synthetic data for 12 dwellings covering a
full year at 1 min resolution.
Table
4
reports the RMS error, the standard deviation and the RMS% error of
measured and simulated values for all 12 dwellings. These values are computed for
different time scales, showing a good modeling performance in particular for what
regards the daytime period, our main focus to compute the self consumption per-
centage. Indeed the RMSE% calculated from 9 a.m. to 5 p.m. in the whole year for
the 12 dwellings is 8.02 %, showing a good capability of the simulator to model the
human behavior during the day.
Table 4 Model validation results. percentage mean error, RMSE, SD and RMSE% between the
simulated and measured values
Time Scale
Mean error (%)
RMSE (KWh)
SD (Wh)
RMSE (%)
Daytime
0.56
0.514
0.408
8.02
Daily
0.35
1.062
0.890
11.58
Weekly
0.29
6.012
4.360
7.11


Search WWH ::

Custom Search