Information Technology Reference
In-Depth Information
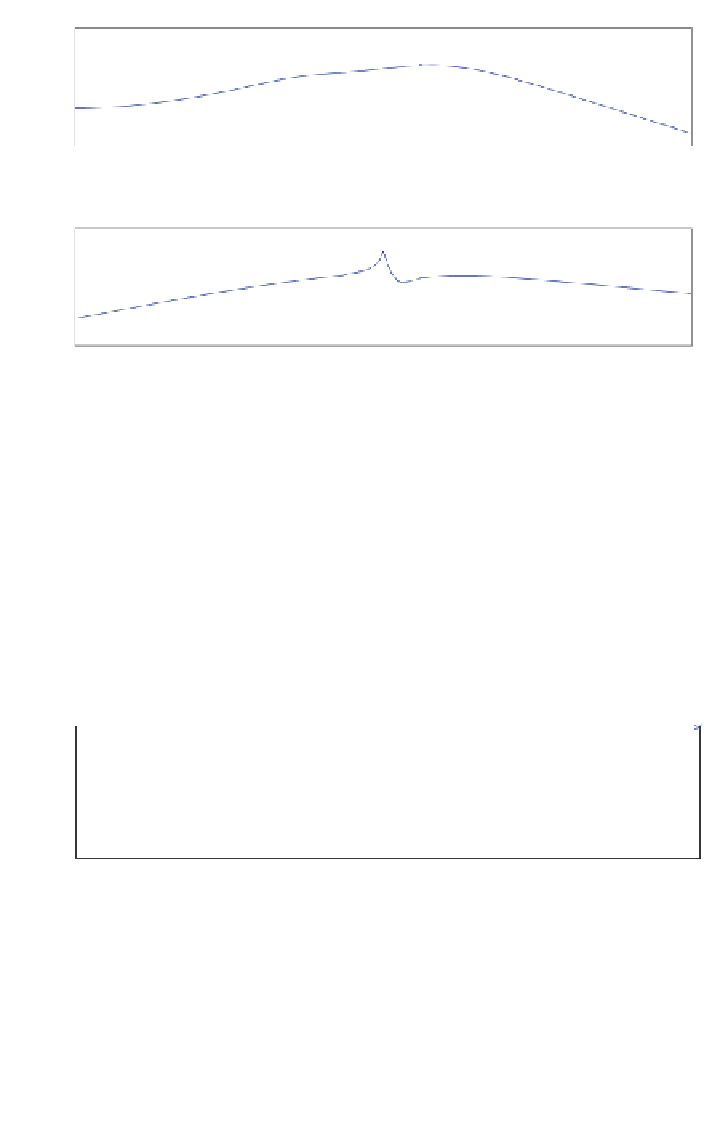
Singular Values of the Error (sub−system1)
0
−20
−40
−60
10
−1
10
0
10
1
10
2
10
3
10
4
Frequency (Hz)
Singular Values of the Error (sub−system2)
50
0
−50
−100
−150
10
−1
10
0
10
1
10
2
10
3
10
4
Frequency (Hz)
Fig. 12 Absolute error system between original switched system (FOM of order 1006) and the
reduced one of order (10) with IDRK-SLS method
the reduced one, note that the error is small over the entire frequency range. The
distribution poles in the complex plane of each subsystem is depicts in Fig.
13
, all
poles are negative real part, then the subsystems are stable.
The Fig.
14
presents the largest singular value of the frequency response of the
original switched linear system (order 348) and reduced one (order 24) to a fre-
quency range by IDRK-SLS method. When a good correlation between the original
400
200
0
−200
−400
−400
−350
−300
−250
−200
−150
−100
−50
0
Real part
400
200
0
−200
−400
−500
−400
−300
−200
−100
0
Real part
Fig. 13 Poles distribution of FOM reduced switched system (order 10) with IDRK-SLS method


Search WWH ::

Custom Search