Information Technology Reference
In-Depth Information
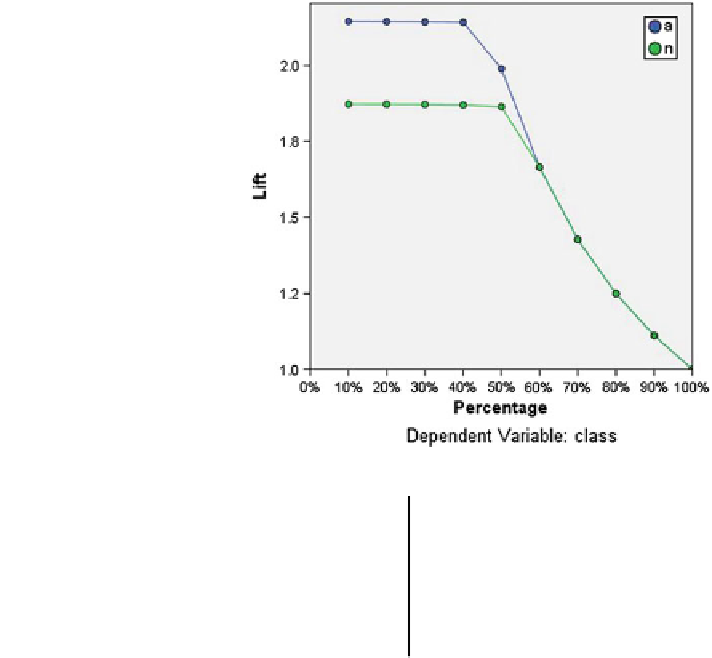
Fig. 12 Lift chart, dependent
variable: class
Table 9 Comparison of three
neural network architecture
based on common measures
of performance
BPN
Recurrent
PCA
Sensitivity
0.9848
0.9650
0.9828
Specificity
0.9924
0.9306
0.9594
Overall accuracy
0.9889
0.9490
0.9719
Kappa statistic
0.9630
0.8970
0.9430
TSS
0.9772
0.8956
0.9422
but removes nearly half of total attacks. If a very large data set is the priority, then
Type II error may be minimised. On the chart, this might correspond to rejecting the
top 10 %, which captures 20 % of the anomaly and leaves most of KDD99 data set
intact. Usually, both are major concerns, so a decision rule should have been chosen
for classifying attacks that gives the best mix of sensitivity and speci
city.
The lift chart in Fig.
12
is derived from the cumulative gains chart; the values on
the y axis correspond to the ratio of the cumulative gain for each curve to the
baseline. Thus, the lift at 10 % for the category Yes is 30 %/10 % = 3.0. It provides
another way of looking at the information in the cumulative gains chart.
Note: The cumulative gains and lift charts are based on the combined training
and testing samples (Table
9
).


Search WWH ::

Custom Search