Information Technology Reference
In-Depth Information
the testing outcomes have been calculated from Table
5
as 0.991045638,
0.988887419 respectively. Unfortunately, the single cutoff value (>zero) gives a
very limited view of the predictive ability of the network, so it is not necessarily
very useful for comparing competing networks rather focus should be on ROC
curve
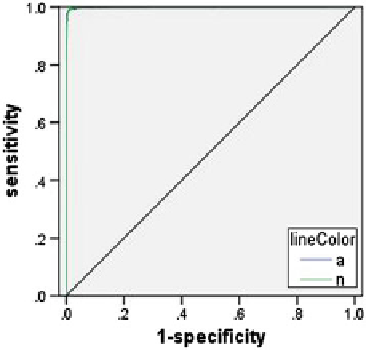
The Fig.
9
displays ROC curve that gives a visual display of the sensitivity and
speci
city for all possible cutoffs in a single plot, which is much cleaner and more
powerful than a series of tables. The
figure depicts here shows two curves, one for
the category anomaly and one for the category normal. Since it is binary, the curves
are symmetrical about a 45
line from the upper left corner of the chart to the lower
right. This graph is based on the combination of training and testing samples.
The area under the curve is a numerical summary of the ROC curve, and the
values in the table represent, for each category, the probability that the predicted
pseudo-probability of being in that category is higher for a randomly chosen case in
that category than for a randomly chosen case not in that category. In Table
8
, for a
randomly selected anomaly and randomly selected normal, there is a 0.999 prob-
ability that the model-predicted pseudo-probability of anomaly will be higher for
the anomaly than for the normal. While the area under the curve is a useful one-
statistic summary of the accuracy of the network, it is required to choose a speci
°
c
criterion by which network intrusion is classi
ed. The predicted-by-observed chart
provides a visual start on this process (Fig.
10
).
Fig. 9 ROC curve
Table 8 Area under the
curve
Area
Class
a
0.999
n
0.999


Search WWH ::

Custom Search