Information Technology Reference
In-Depth Information
80
75
70
65
60
55
50
45
40
35
30
25
20
2000
2100
2200
2300
2400
2500
2600
2700
2800
2900
3000
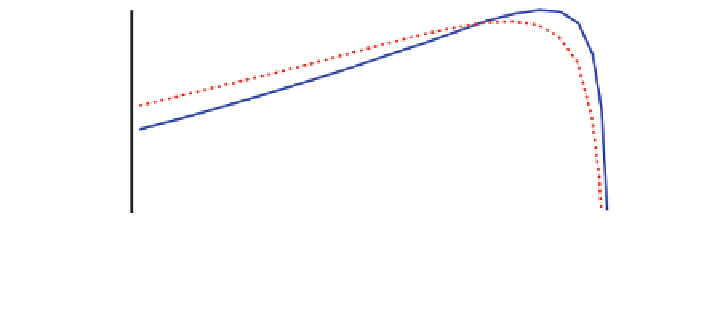
Speed [RPM]
Fig. 1 Ef
ciency characterization of tested induction motors. Blue solid line refers the healthy
motor, red dashed line refers to motor with defective rotor
twenty-one different motor conditions, which are: one healthy condition, ten broken
bars conditions and ten broken connectors conditions. Twenty time series are
generated for each motor condition. Each signal consists of 1,500 samples. The
dataset can be download from UCR time series data mining archive in Keogh
(
2013
). The characteristics of the three-phase induction motors are: 208 V input
voltage, 60 Hz supply frequency, 34 rotor bars, 2 poles and power 1.2 hp. The
sampling rate is 33.3 kHz and the processed data, for each test, are related to 0.3 s
of acquisition. White noise with standard deviation
r
¼
:
2 is added to the simu-
lated current signals. The results are the average of 200 Monte Carlo simulations
where the training and testing data sets are randomly changed.
The real tests are carried out using three phase induction motors whose
parameters are: 380 V input voltage, 60 Hz supply frequency, 0.75 kW power, 20
kHz sampling rate. Two different faults are tested: wrong rotor and cracked rotor.
Wrong rotor refers to a non compliant rotor, in particular a single phase rotor is
assembled instead of a three phase rotor. Ten motors are tested both for the healthy
and faulty cases. The acquisition time is 14 s. The processed data, for each test, are
related to 0.7 s of acquisition. In this case study the results are the average of 2,000
Monte Carlo simulations where the training and testing data sets are randomly
changed. The motors, with a defective rotor installed, have about 3 % of ef
0
ciency
drop at the operating point of 2,800 RPM, as shown in Fig.
1
. So it is important to
detect this defect in the energy ef
ciency context and QC.
3.1 Results and Discussion
The proposed approach processes the three-phase stator currents in order to perform
defects detection and diagnosis as described in Sect.
2.2
. The following two sub-
sections show the results related to the two cases described previously. Figures
2
,
3
,
4
and
5
show the simulation and experimentation results. The classi
cation
accuracy is considered as an index to evaluate the performances of the proposed


Search WWH ::

Custom Search