Information Technology Reference
In-Depth Information
(a)
(b)
10
10
9
9
8
8
7
7
6
6
estimated y
real y
estimated y
real y
5
5
4
4
0
100
200
300
400
500
600
700
800
0
200
400
600
800
t(s)
t(s)
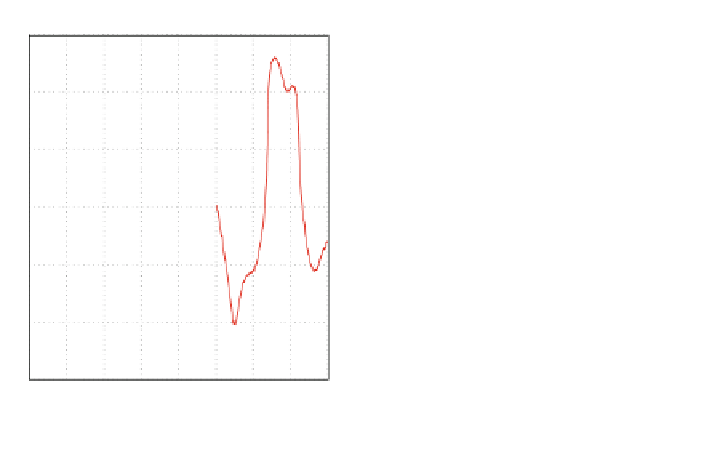
Fig. 9 The validation outputs a with Chiu, and b with DBSCAN
(a)
(b)
12
12
10
10
8
8
6
6
real pH
estimated pH
estimated pH
real pH
4
4
2
2
0
5
10
15
20
25
30
0
5
10
15
20
25
30
q
3
(ml/s)
q
3
(ml/s)
Fig. 10 The validation of the titration curve a with Chiu, and b with DBSCAN
Table 8 Quality measures
with the two proposed
methods
Chiu
DBSCAN
FIT for identification
98.0203
97.8688
FIT for validation
98.1254
98.0405
10
−
4
e
8.8552
×
0.0013
r


Search WWH ::

Custom Search