Information Technology Reference
In-Depth Information
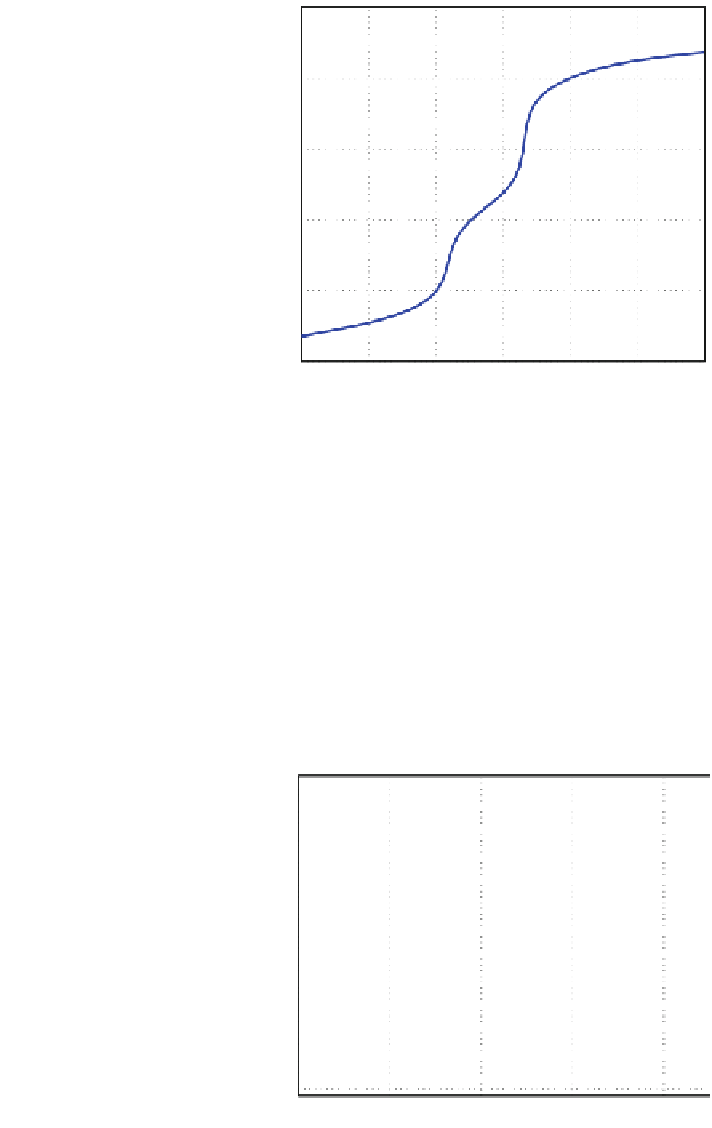
Fig. 6 The titration curve
12
10
8
6
4
2
0
5
10
15
20
25
30
q
3
(ml/s)
5.4.2 Structure Identi
cation
It was mentioned that the early approaches of identi
cation of pH neutralization
process approximate this process around an operating range as a First Order Plus
Delay Time model. Added to that, the evolution of the pH in Fig.
7
, for a
xed
values of the input q
3
, is similar to a
rst order system response.
Therefore, we propose to represent the sub-models by a discrete
first order plus
dead time models (n
a
=1,n
b
=2)de
ned by:
Fig. 7 The pH evolution with
different values of q
3
11
q
3
= 30(ml/s)
q
3
= 20(ml/s)
10
9
8
7
q
3
= 15(ml/s)
6
5
q
3
=10(ml/s)
q
3
= 5(ml/s)
4
3
0
200
400
600
800
t(s)


Search WWH ::

Custom Search