Information Technology Reference
In-Depth Information
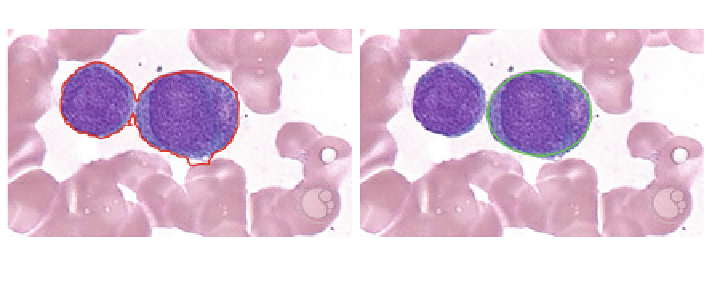
(a)
(b)
Fig. 12 Result comparison for the white blood cells detection showing (a) Wang
'
s algorithm after
400 cycles and (b) DE detector method considering 1,000 cycles
(instability). Such number must be determined experimentally as it depends on the
image context and its complexity. Figure
12
a shows the result of applying 400
cycles of the Wang
s algorithm while Fig.
12
b presents the detection of the same
cell shapes after 1,000 iterations using the proposed algorithm. From Fig.
12
a, it can
be seen that the contour produced by Wang
'
s algorithm degenerates as the iteration
process continues, wrongly covering other shapes lying nearby.
In order to compare the accuracy of both methods, the estimated WBC area
which has been approximated by both approaches, is compared to the actual WBC
size considering different degrees of evolution i.e. the cycle number for each
algorithm. The comparison considers only one WBC because it is the only detected
shape in the Wang
'
s method. Table
5
shows the averaged results over twenty
repetitions for each experiment. In order to enhance the analysis, Fig.
13
illustrates
the Error-percentage versus Iterations evolution from an extended data set which
has been compiled from Table
5
.
'
Table 5 Error in cell
s size
estimation after applying the
DE algorithm and the Wang
'
s
method to detect one
leukocyte embedded into a
blood-smear image. The error
is averaged over twenty
experiments
'
Algorithm
Iterations
Error (%)
Wang
30
88
60
70
200
1
400
121
600
157
DE-based
30
24.30
60
7.17
200
2.25
400
2.25
600
2.25


Search WWH ::

Custom Search