Geoscience Reference
In-Depth Information
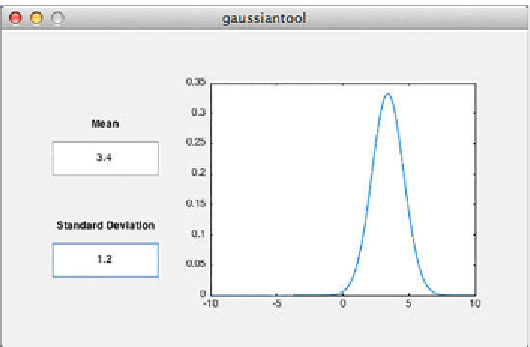
Fig. 2.5
Screenshot of the graphical user interface (GUI)
gaussiantool
for plotting a
Gaussian function with a given mean and standard deviation. h e GUI allows the values of
the mean and standard deviation to be changed in order to update the graphics on the right.
h e GUI has been created using the MATLAB
GUI Design Environment
(GUIDE).
function calculating_gaussian(hObject, eventdata, handles)
% hObject handle to edit2 (see GCBO)
% eventdata reserved - to be defined in a future version of MATLAB
% handles empty - handles not created until after all CreateFcns called
global mmean mstd
x = -10 : 0.1 : 10;
y = normpdf(x, mmean, mstd);
plot(x,y)
h e second callback
edit2_Callback
picks the value of the standard deviation
mstd
from the second Edit Text area, which is then also used by the function
calculating_gaussian
.
global mstd
mstd = str2double(get(hObject,'String'));
calculating_gaussian(hObject, eventdata, handles)
At er saving the i le
gaussiantool.m
we can run the new GUI by typing
gaussiantool
in the Command Window. h e GUI starts where we can change the values of
the mean and the standard deviation, then press return. h e plot on the right
is updated with each press of the return key. Using
edit gaussiantool
guide gaussiantool