Geoscience Reference
In-Depth Information
a
b
c
d
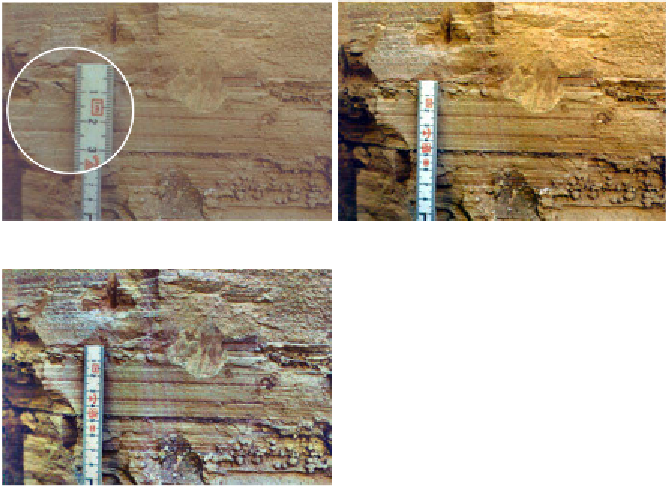
Fig. 8.6
Results of image enhancements;
a
original image,
b
image with intensity values
adjusted using
imadjust
, Gamma=1.5,
c
image with contrast enhanced using
adapthisteq
,
d
image at er i ltering with a 20-by-20 pixel i lter with the shape of a Gaussian probability
density function with a mean of zero and a standard deviation of 10, using
fspecial
and
imfilter
.
revealing that the image is stored as an
uint8
array of the size 1,096-by-1,674-
by-3, i.e., 1,096-by-1,674 arrays for each color (red, green and blue). We can
display the image using the command
imshow(I1)
which opens a new Figure Window showing an RGB composite of the image.
As we see, the image has a low level of contrast and very pale colors, and the
sediment layers are not exactly horizontal. h ese are characteristics of the
image that we want to improve in the following steps.
First, we adjust the image intensity values or colormap. h e function
imadjust(I1,[li; hi],[lo ho])
maps the values of the image
I1
to new values
in
I2
, such that values between
li
and
hi
are adjusted to values between
lo
and
ho
. Values below
li
and above
hi
are clipped, i.e., these values are
adjusted to
lo
and
ho
, respectively. We can determine the range of the pixel