Geoscience Reference
In-Depth Information
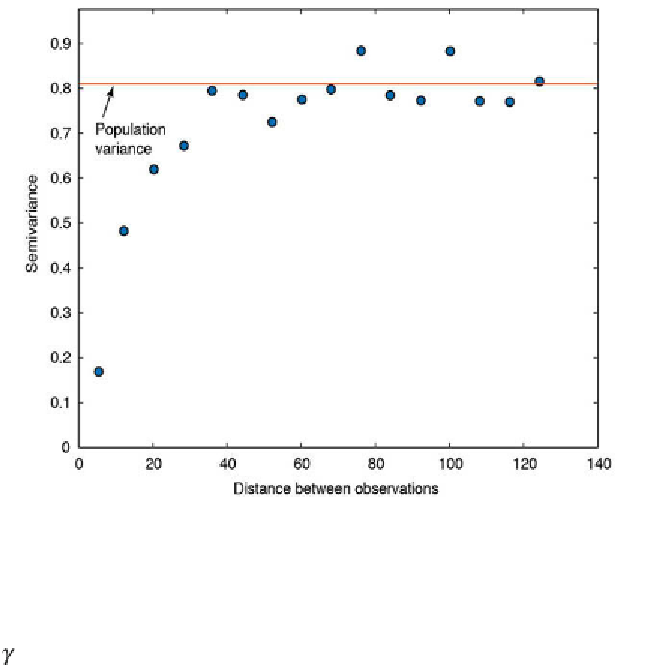
Fig. 7.20
h e classical variogram estimator (blue circles) and the population variance (dashed
line).
Linear model:
where
c
is the sill,
a
is the range, and
b
is the slope (for a linear model).
h e parameters
c
and either
a
or
b
must be modii ed if a variogram model
is i tted to the variogram estimator. h e
nugget ef ect
is a special type of
variogram model. In practice, when extrapolating the variogram towards a
separation distance of zero we ot en observe a positive intercept on the
y
-axis.
h is is called the nugget ef ect and it is explained by measurement errors
and by small scale l uctuations (
nuggets
) that are not captured due to the
sampling intervals being too large. We sometimes have expectations about
the minimum nugget ef ect from the variance of repeated measurements in
the laboratory, or from other prior knowledge. More details concerning the
nugget ef ect can be found in Cressie (1993) and Kitanidis (1997). If there is
a nugget ef ect, it can be added into the variogram model. An exponential
model with a nugget ef ect looks like this: