Geoscience Reference
In-Depth Information
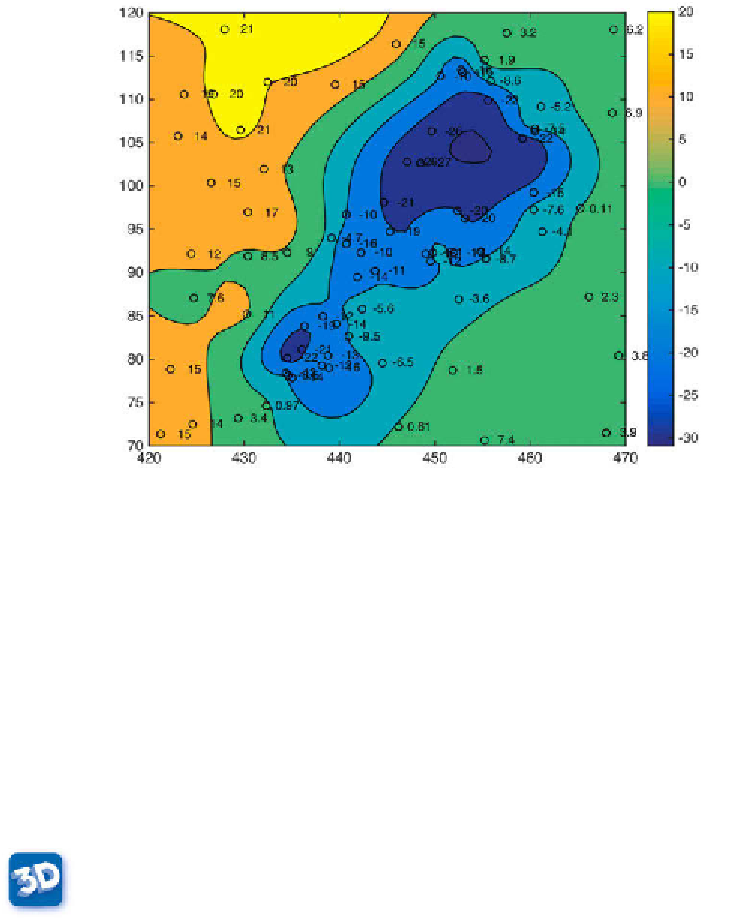
Fig. 7.6
Contour plot with the locations (small circles) and
z
-values (contour labels) of the
true data points.
white
colormap.
surf(XI,YI,ZI), colormap('hot'), colorbar
Using
Rotate 3D
only rotates the 3D plot, not the colorbar. h e function
surfc
combines both a surface and a 2D contour plot in one graph.
surfc(XI,YI,ZI)
h e function
surfl
can be used to illustrate an advanced application for 3D
visualization, generating a 3D colored surface with interpolated shading
and lighting. h e axis labeling, ticks, and background can be turned of by
typing
axis off
. In addition, black 3D contours can be added to the surface,
as above. h e grid resolution is increased prior to data plotting in order to
obtain smooth surfaces (Fig. 7.7).
Interactive
7.7
[XI,YI] = meshgrid(420:0.25:470,70:0.25:120);
ZI = griddata(data(:,1),data(:,2),data(:,3),XI,YI,'v4');
surf(XI,YI,ZI), shading interp, light, axis off, hold on
contour3(XI,YI,ZI,v,'k'), hold off