Geoscience Reference
In-Depth Information
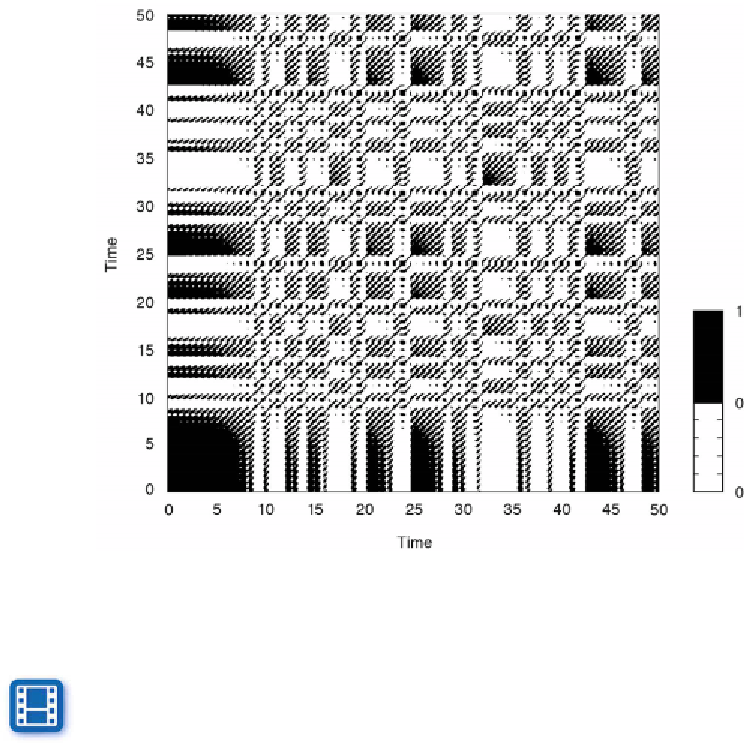
Fig. 5.25
h e recurrence plot for the Lorenz system using a threshold of ʵ=2. h e regions with
regular diagonal lines reveal unstable periodic orbits, typical of chaotic systems.
lines represent periods of time during which the phase space trajectory runs
parallel to earlier or later sequences in this trajectory, i.e., periods of times
during which the states and dynamics were similar. h e distances between
these diagonal lines represent the periods of the cycles, which vary and are
not constant, in contrast to those for a harmonic oscillation (Fig. 5.22).
Movie
5.4
Recurrence Quantii cation
h e structure of recurrence plots can also be described by a suite of
quantitative measures. Several measures are based on the distribution of
the lengths of diagonal or vertical lines, as well as on the local proximity
coni guration. h ese measures can be used to trace hidden transitions within
a process. As an example we will consider two measures: the recurrence
rate and the transitivity coei cient. h e recurrence rate is the density of
points in the recurrence plot and corresponds to the recurrence probability