Geoscience Reference
In-Depth Information
b
a
d
c
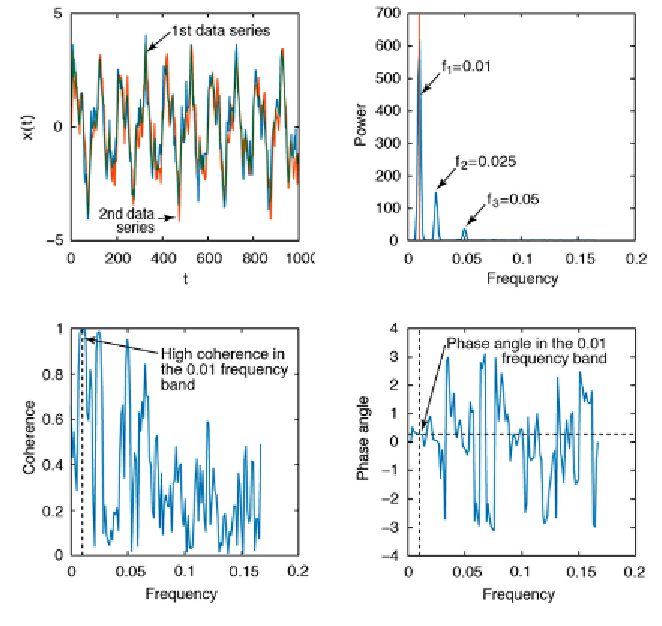
Fig. 5.10
Result from cross-spectral analysis of the two linearly-interpolated signals:
a
signals
in the time domain,
b
cross-spectrum of both signals,
c
coherence of the signals in the
frequency domain, and
d
phase spectrum in radians.
plot(f,phase)
xlabel('Frequency')
ylabel('Phase Angle')
title('Phase spectrum')
h e phase shit at a frequency of
f
=0.01 is calculated using
interp1(f,phase,0.01)
which produces the output of
ans =
-0.2796
h e phase spectrum is normalized to a full period ˄=2ˀ and the phase